Document Designer
You must have designer rights to create and edit documents.
Use the Document Designer to present data in the format of a report when the screen limitations of a dashboard aren't sufficient. A document works better than a dashboard if you're creating a weekly or monthly report that contains dozens of charts, graphs, or lists that run to multiple pages (Word or PDF files), tabs (Excel spreadsheets), or slides (PowerPoint presentations).
As with dashboards, you can export documents to save for future reference or send via email to key stakeholders. If your company has purchased an Enterprise Server license, these stakeholders can view documents without consuming an Xtraction analyst license. For details, see About Xtraction viewers.
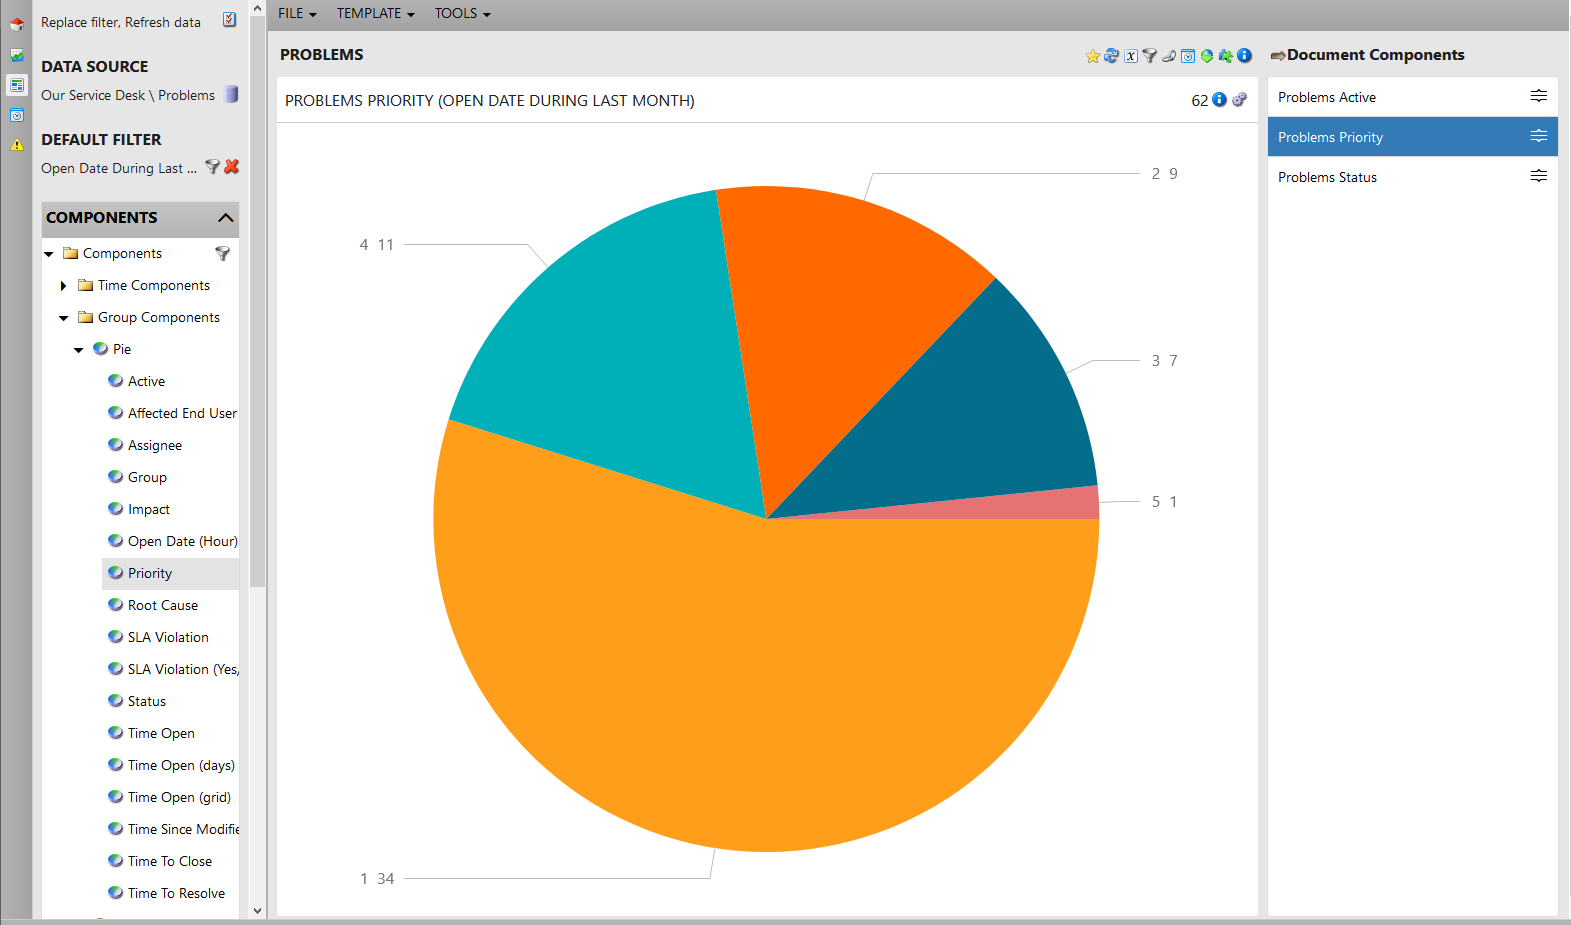
When using the Document Designer, you have the left navigation pane, as well as the design canvas that displays two distinct panes:
•The central pane graphically displays one component at a time that's included in the document.
•The right pane lists all components included in the document composition. Click any one of the listed components to display it individually in the central pane. You can include any number of components of any type in a document, because you're not constrained by screen real estate.
Getting started
Open the Document Designer by clicking the ![]() icon in the toolbox. To get started, use the same method as detailed for creating a dashboard:
icon in the toolbox. To get started, use the same method as detailed for creating a dashboard:
•In the navigation pane, select the data-source target and define any optional filters. For details about using filters, see Creating filters.
•Expand the components list in the navigation pane, then drag and drop components onto the central pane. It doesn't matter if a component is already displayed; dragging another one to that area adds it to the layout. Continue adding components to the central pane until you have a complete document. For details about components, see About components.
•Click a component in the right pane to bring it into focus in the central pane. Use action icons in the header to interact with a displayed component and tailor its design settings. Click a single data point to apply temporary filters or view an underlying record list. For details about these interactive features, see Dashboard Designer.
•Use the Tools menu to incorporate any filters or saved dashboards.
•To sort components in the right pane, use the icon to move a component up or down the list. Right-click a component to edit, copy, or remove it.
•To add parameters that enable you to view documents with specific values, see Adding parameters to dashboards and documents.
•When your design is complete, click the File > Save menu. To export the document, see the procedures below.
Copying components from one document or dashboard to another
You can copy individual components between documents and dashboards, making it easy to design a new dashboard or document that's a composite of components from an older design.
Only dashboards and documents in design mode can have a component copied to them, but components in view mode can be copied.
1.Open an existing document.
2.In the Document Components pane, click the component you want to copy so that it displays in the central pane.
3.In the upper-right corner of the central pane, expand the ![]() icon, then click the
icon, then click the ![]() icon to copy the component.
icon to copy the component.
4.Open another dashboard or document (new or existing) to copy the component to:
•If copying to a dashboard: Right-click in a pane where you want the component to display, then click the Paste button. In existing dashboards, this component will replace the original component in the pane. To add this component to the original composite, first click the ![]() icon in the dashboard header and select a new layout with more panes, then right-click in a new, empty pane and click the Paste button.
icon in the dashboard header and select a new layout with more panes, then right-click in a new, empty pane and click the Paste button.
•If copying to another document: Right-click in the central pane of the document, then click the Paste button. The component will become part of the composite by displaying in this pane as well as the Document Components list in the right pane.
5.Repeat as needed, then save your changes.
Copying components from Document Designer to Exportable component
You can copy a component from the Document Designer to an Exportable component, where any tabular data that can be converted to a graph-based pictorial form will be automatically transformed.
1.In the left navigation pane, click the ![]() icon to open the Document Designer page.
icon to open the Document Designer page.
2.Click on File to select the component you want to copy to Exportable. Now, in the upper-right corner of the component pane, expand the gear ![]() icon, then click on the
icon, then click on the ![]() icon to copy the component.
icon to copy the component.
3. Now, click on the Exportable component icon on the left navigation pane and paste it. You can view the copied component.
-
Only components supported by Exportable Designers can be pasted. In case of unsupported components, you will get an error message at the bottom.
-
To learn more about scheduling an export, see the procedure To schedule a content export in Scheduling exports.
Exporting
You can export documents to these formats: Word, PDF, HTML, Excel, CSV, or PowerPoint. To schedule periodic exports, see Scheduling exports.
1.In the document header, click the ![]() icon to export all components that comprise the document. To export at the individual component level, click the same icon in the header of the in-focus component. (You may need to click the
icon to export all components that comprise the document. To export at the individual component level, click the same icon in the header of the in-focus component. (You may need to click the ![]() icon to display the
icon to display the ![]() icon.)
icon.)
2.In the Export Document dialog, set the following options: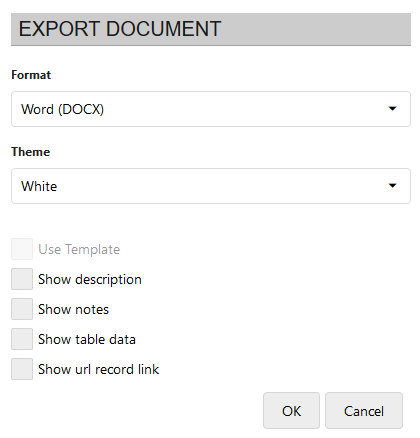
•Format: Select the file format for the export. If exporting to CSV, multiple components will export as separate CSV files contained in a single downloaded ZIP file.
•Theme: Select the overall background color to be black or white. The white theme helps save on toner when printing.
•Use template: Export to a Word template. (If the content wasn't designed for use with a template, this option is dimmed.)
•Show description: Include a summary of the series, data source, and filter conditions used in the content.
•Show notes: Include any of the optional notes that are part of this document.
•Show table data: Include data that's presented in tables. As this option can export a lot of data, carefully consider the number of records you'll be exporting.
•Show URL record link: For list components only. Embeds URL links in the exported record list that can open specific records (such as service desk incidents) in the native application.
3.Click OK.
4.Click Save File, then OK to save the file in the Downloads folder defined for your browser.
If exporting to Word, you can customize the formatting of a document with an Xtraction-generated Word template. To do so, complete a three-step process—first, create and edit the template to your liking; next, upload the template into Xtraction; and finally, export the document content to the template.
To create and edit a template
Before exporting, make sure that your document composition is complete and saved.
1.Click the Template > Create > Landscape or Portrait menu.
2.Xtraction creates the template and opens the standard Windows Open/Save dialog.
3.Click Save File, then OK to save the file in the Downloads folder defined for your browser. If you want to edit the template after saving, right-click the DOTX file and select Open to open it. (To ensure that you open the DOTX file and not a DOCX version of the file, don't double-click to open it.)
The template created by Xtraction is simple in layout and contains an image placeholder for each component within the document. Xtraction uses the placeholders to insert the components into the template. Each placeholder has the word TITLE at the top, which is replaced by the source component title when the document is exported (components are exported in top-down order from the document components list).
You're free to modify the template in the following ways:
•Change or delete the Xtraction-generated titles.
•Intersperse the image placeholders anywhere within the document—just don't delete any of them.
To upload the template into Xtraction
1.Click the Template > Upload Template menu. Your browser will open a window enabling you to locate the template in your folders.
2.Double-click the document and click Upload. Xtraction acknowledges this process by confirming the upload.
3.Click the File > Save menu to save the template with the design.
The Template menu also enables you to download a template, provided that one already exists.
Once the template is uploaded and saved, you can then export the document content. For details, see the procedure above "To export a document."