Dashboard Designer
You must have designer rights to create and edit dashboards.
The Dashboard Designer enables you to create interactive dashboards that provide real-time access to the data needed for your daily tasks. Use this tool to perform ad-hoc analyses of data when existing reports aren't adequate or you don't have time to build new ones.
You can also export dashboards to save for future reference or send via email to key stakeholders. If your company has purchased an Enterprise Server license, these stakeholders can view dashboards without consuming an Xtraction analyst license. For details, see About Xtraction viewers.
The Dashboard Designer is simple to use—choose a layout, select a data source, add filters, and then drag and drop various components onto the design canvas. As you build a dashboard, you'll receive instant feedback from the data and can immediately interact with various data points.
When you need to present a large amount of data as a report that doesn't fit well onto a single screen, a document works better than a dashboard. In that case, use Xtraction's Document Designer tool. For details, see Document Designer.
Creating a basic dashboard
The following procedure leads you though the process of creating a basic dashboard. Before starting, you may want to read about:
•Navigating the user interface. For details, see About navigation.
•Using components in dashboards. For details, see About components.
•Filtering dashboard content. For details, see Creating filters.
•Using parameters to view dashboards with specific values. For details, see Adding parameters to dashboards and documents.
•Managing your folder structure, which includes defining who can view the dashboards within a folder. For details, see Managing folders.
1.Open the Dashboard Designer by clicking the ![]() toolbox icon left of the navigation pane.
toolbox icon left of the navigation pane.
2.In the top menu bar, click File > New to open the Dashboard dialog.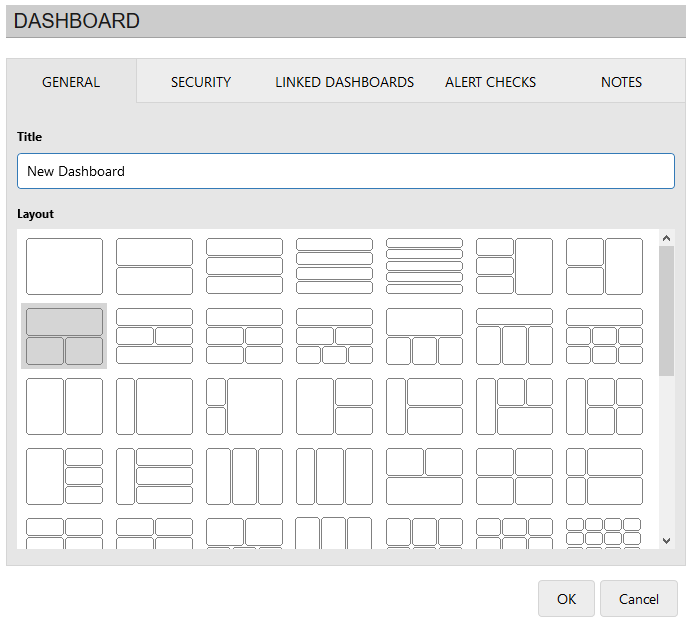
3.Under the General tab, enter a descriptive title for the dashboard. Also select the layout for how this dashboard will display in the design canvas. Generally, the default one-over-two pane layout is recommended. Each pane in the layout can contain one component.
4.After selecting a layout, you can change it at any point without losing your work by clicking the ![]() icon in the dashboard header. If needed, you can select a customized layout that enables you to resize the panes. For details, see About dashboard properties, alerts, and defaults.
icon in the dashboard header. If needed, you can select a customized layout that enables you to resize the panes. For details, see About dashboard properties, alerts, and defaults.
For a simple dashboard, none of other tabs in this dialog are necessary. Click OK. For details about the other tabs, such setting up an alert to monitor data-status updates, see About dashboard properties, alerts, and defaults.
5.To select a data source to report against, click the ![]() icon in the left navigation pane. In the Select Data Source dialog, scroll down the list of available data sources and find one to connect to. Expand the data source and select a "view" for this dashboard (in the image below, that would be "Incidents"). Click OK. The navigation pane updates to display the data source and view you selected.
icon in the left navigation pane. In the Select Data Source dialog, scroll down the list of available data sources and find one to connect to. Expand the data source and select a "view" for this dashboard (in the image below, that would be "Incidents"). Click OK. The navigation pane updates to display the data source and view you selected.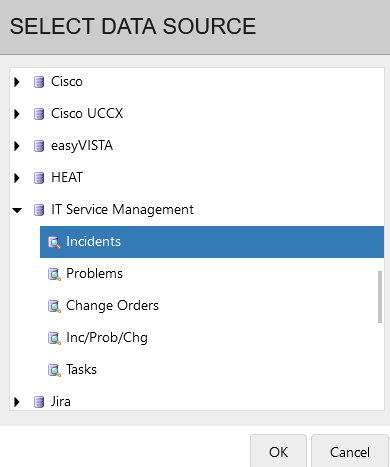
6.In the navigation pane, you'll notice that in most cases a Default Filter is loaded to reduce the viewable data to the last calendar month. For this procedure, you can leave the default filter as is, or you can add a filter condition to it to further narrow the data results:
•Let's assume you're creating a dashboard for service desk incidents, and you want to see only one group's assigned tickets for the last month. To add a filter condition:
•Click the Default Filter ![]() icon. In the Edit Filter dialog, right-click in the blank area and select Add Condition(s). For the field, select Group, then Equals, then search for and add a group's name as a value (such as "MAC Support" in the image below).
icon. In the Edit Filter dialog, right-click in the blank area and select Add Condition(s). For the field, select Group, then Equals, then search for and add a group's name as a value (such as "MAC Support" in the image below). 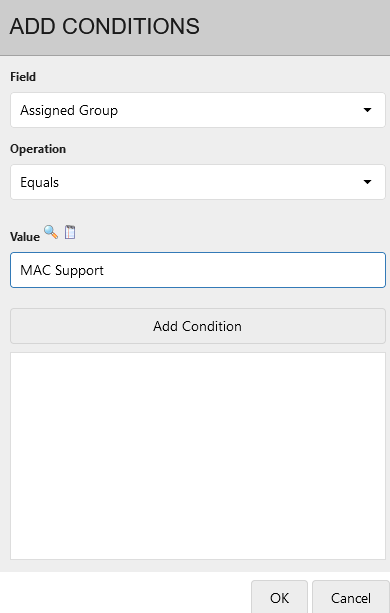
•Click OK. You'll notice that in the Edit Filter dialog, your new filter condition now displays. Click OK.
•The default filter in the navigation pane updates to display the condition you just entered. Now, when you drag and drop a component over to a pane in the design canvas, only the data that meets the filter condition will display.
•As you become familiar with Xtraction, you'll want to learn more about how to effectively use filters to narrow the viewable data. For details, see Creating filters.
7.Now you're ready to add components to the empty panes of your dashboard layout. Components let you view the data in different ways:
• Scroll down and expand the navigation pane's components list until you find data that you want to view in the form of graphs, charts, and more.
•Drag and drop a component into one of the panes of your dashboard. Once you do that, Xtraction will query the selected data source for the data and display the results in the pane.
•Each pane can contain one component. To change the data in a pane, drag and drop a new component on top of the current one. When replacing a component, ensure that you release your cursor in the pane and not on the pane's header, which will cause the action to fail.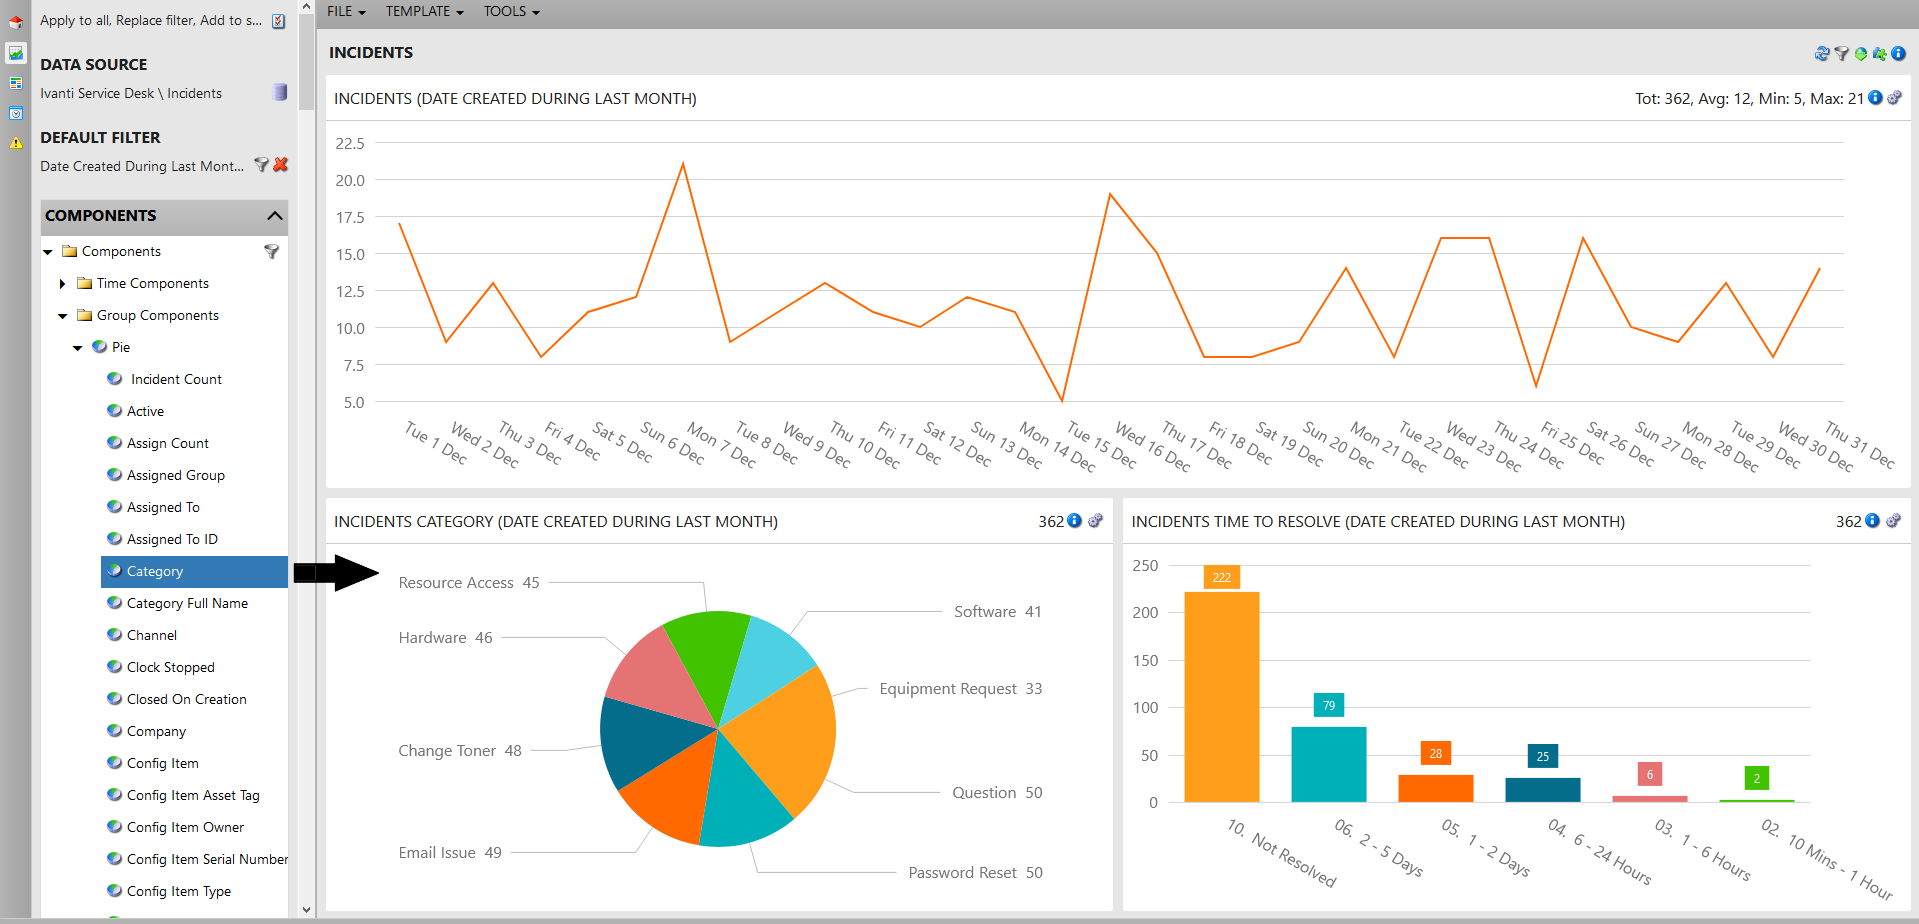
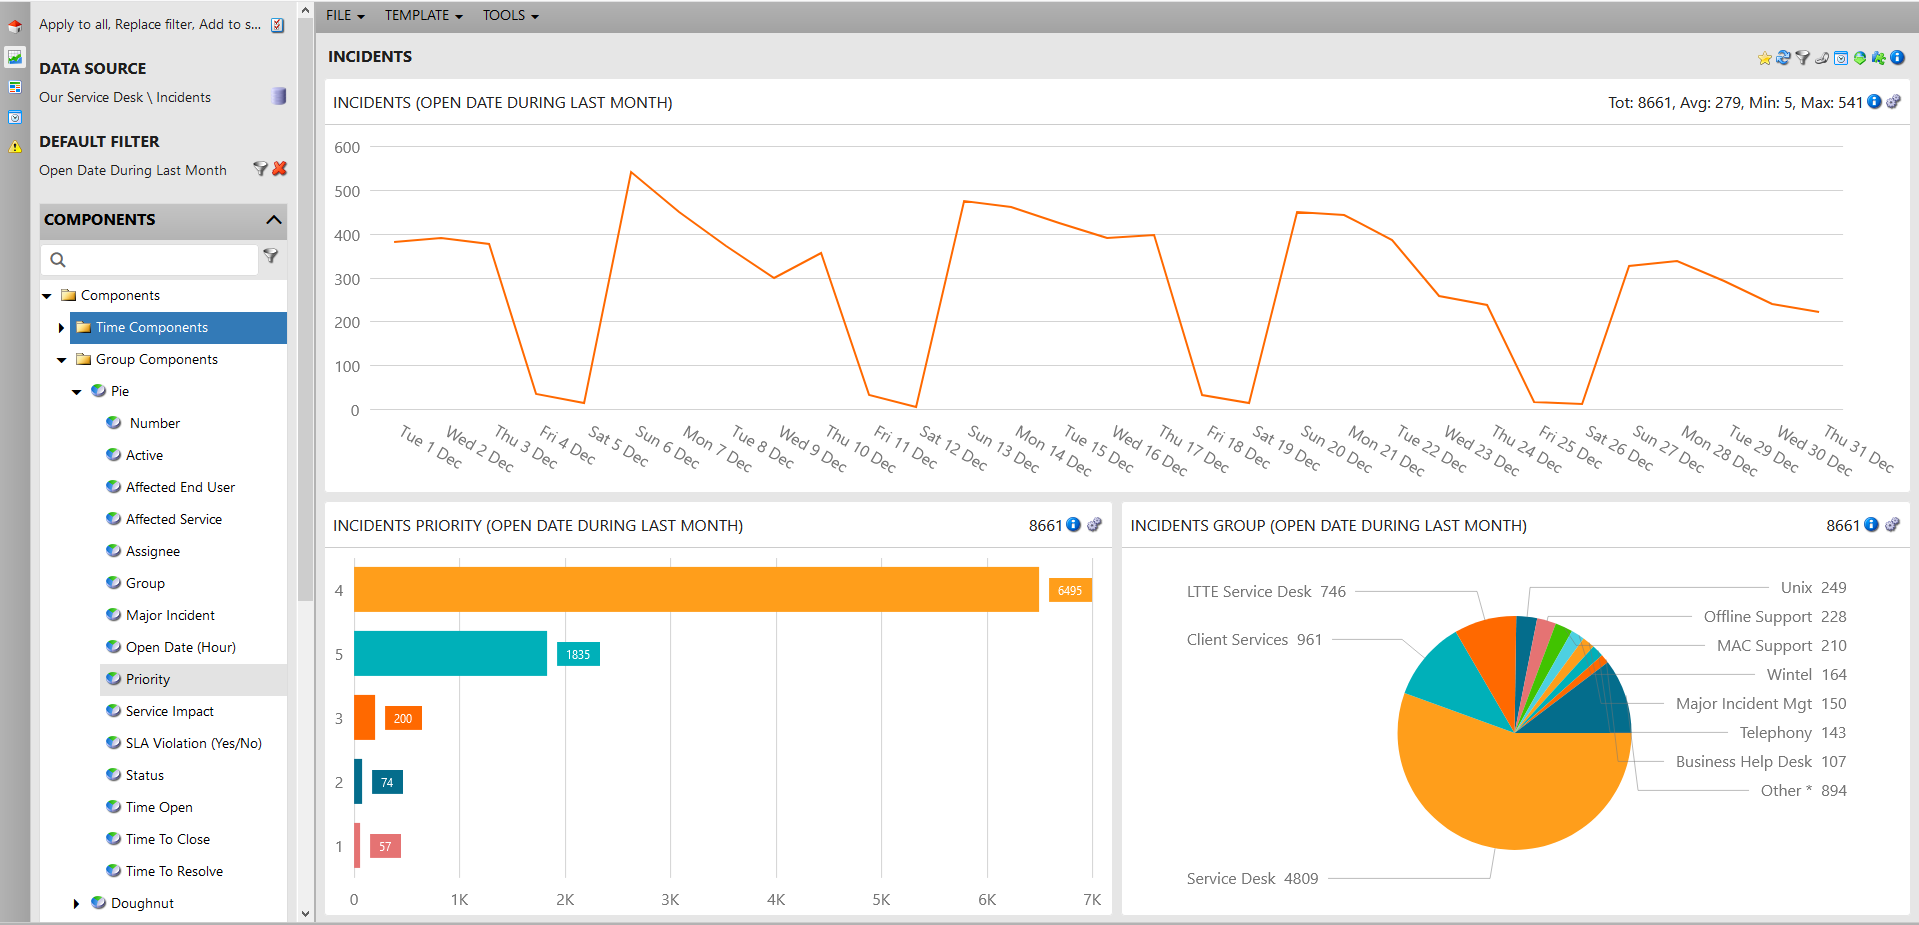
Continuing the service desk example, here are some ways to view a group's assigned incidents for the month:
•To view the number of assigned incidents per day, add a Time component > Line chart to one pane.
•To view incidents by Category, add a Group component > Pie chart to another pane.
•To view the Time to Resolve an incident, add a Group component > Column chart to the final pane.
•You'll need to know more about components later on. Some components offer the ability to create more than one series or a calculated series for the viewable data. For details, see About components.
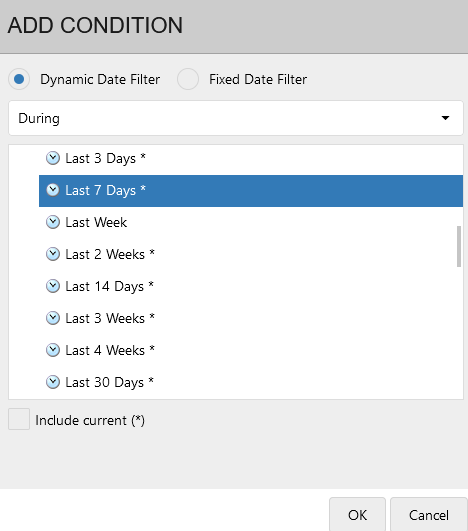
8.To change the date range of the displayed data by updating existing date filters applied to components on this dashboard (components without date filters are not affected):
•Click the ![]() icon in the dashboard header and click Update date filters.
icon in the dashboard header and click Update date filters.
•From the Add Condition dialog, you can change the current display using a dynamic date or fixed date filter. For this example, use a dynamic date filter to change the date range to incidents from the Last 7 days, then click OK. The dashboard data will update accordingly.
9.To view data points in greater detail:
•Hover your mouse over one the data points in a pane (for example, a pie chart segment), then click and select View Records. A new page will display, listing the underlying records associated with that particular data. You can drill down even farther by opening an individual record in the list.
•You can also create temporary filters based on a single data point. For details, see "Interactive features" below.
10.You now have a completed dashboard. Click File > Save to save it in a folder, then click OK. To open this dashboard again, click File > Open and navigate the folder structure to locate this dashboard. Click it to open.
At any point you can convert a saved, fixed-layout dashboard to an editable one by using the Tools > Convert to Resizable menu. Make sure you re-save the dashboard after doing so. For details on manipulating the layout of an editable dashboard, see the procedure To configure dashboard properties in About dashboard properties, alerts, and defaults.
Viewing the underlying data
Each dashboard comprises any number of individual panes, each displaying a specific type of data identified by the pane title. Within each pane, you can drill deeper to view the underlying data (though what you can view is dependent on the type of data displayed).
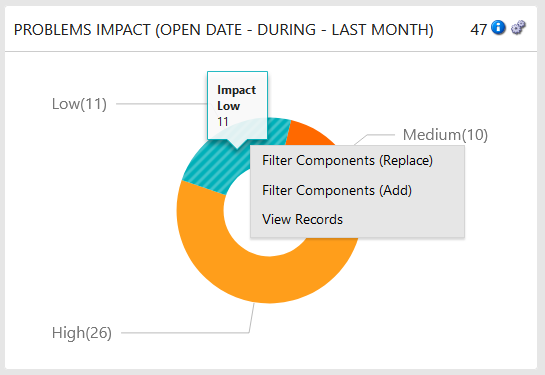
Click the record count number in a pane header ("47" in the image below) to display the full list of detailed records underlying the component. Not all components have record counts.
Click a single data point (such as "Impact Low" in the image below) to:
•Filter Components (Replace): Select to create a temporary filter condition that dynamically filters the rest of the dashboard based on that data point. For example: In the image below, an "Impact Low" filter condition would be applied to each pane in the display to show just the data that relates to low-impact problems from the past month.
•Filter Components (Add): Select to filter the dashboard by combining the first temporary filter condition with a second one based on an additional data point.
•To clear all temporary filters and re-establish the original view: In the pane header, click the ![]() icon. (You may need to click the
icon. (You may need to click the ![]() icon first to expand the icon list.)
icon first to expand the icon list.)
•View Records: Select to display the underlying records contained within the data point. From the display, you can sort columns, export the data (by clicking the ![]() icon), and double-click a record to display it in its native application (if enabled by the administrator). For more details about exporting data, see "Exporting" below.
icon), and double-click a record to display it in its native application (if enabled by the administrator). For more details about exporting data, see "Exporting" below.
Copying components from one dashboard or document to another
You can copy individual components between dashboards and documents, making it easy to design a new dashboard or document that's a composite of components from an older design.
Only dashboards and documents in design mode can have a component copied to them, but components in view mode can be copied.
1.Open an existing dashboard.
2.Select the component you want to copy to another dashboard or document: In the upper-right corner of the component pane, expand the ![]() icon, then click the
icon, then click the ![]() icon to copy the component.
icon to copy the component.
3.Open another dashboard or document (new or existing) to copy the component to:
•If copying to another dashboard: Right-click in a pane where you want the component to display, then click the Paste button. In existing dashboards, this component will replace the original component in the pane. To add this component to the original composite, first click the ![]() icon in the dashboard header and select a new layout with more panes, then right-click in a new, empty pane and click the Paste button.
icon in the dashboard header and select a new layout with more panes, then right-click in a new, empty pane and click the Paste button.
•If copying to a document: Right-click in the central pane of the document, then click the Paste button. The component will become part of the composite by displaying in this pane as well as the Document Components list in the right pane.
4.Repeat as needed, then save your changes.
Copying components from Dashboard Designer to Exportable component
You can copy a component from the Dashboard Designer to an Exportable component, where any tabular data that can be converted to a graph-based pictorial form will be automatically transformed.
1.In the left navigation pane, click the ![]() icon to open the Dashboard Designer page.
icon to open the Dashboard Designer page.
2.Click on File to select the component you want to copy to Exportable. Now, in the upper-right corner of the component pane, expand the gear ![]() icon, then click on the
icon, then click on the ![]() icon to copy the component.
icon to copy the component.
3. Now, click on the ![]() icon on the left navigation pane to open the Exportable component and paste it. You can view the copied component.
icon on the left navigation pane to open the Exportable component and paste it. You can view the copied component.
-
Only components supported by Exportable Designers can be pasted. In case of unsupported components, you will get an error message at the bottom.
-
To learn more about scheduling an export, see the procedure To schedule a content export in Scheduling exports.
Linking dashboards
You can link one dashboard to another, or individual components from one dashboard to another. You can create links to dashboards within the same data source and between different ones. This feature is useful when you need to keep track of related information that spans more than one dashboard.
1.From the header of an open, previously saved dashboard, click the ![]() icon.
icon.
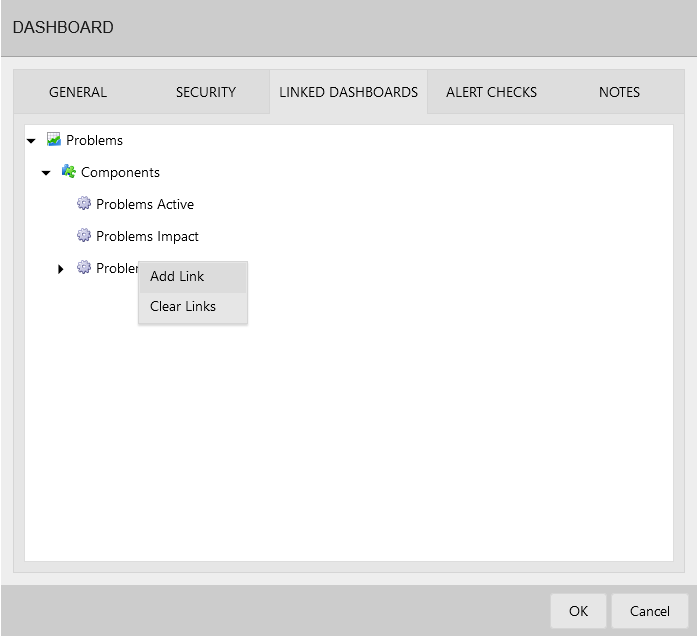
2.Click the Linked Dashboards tab.
3. In the list, right-click this dashboard and select Add link to link it to another dashboard. To link one of this dashboard's components to another dashboard, expand the components list, right-click a component, then select Add link.
4.In the resulting dialog, search the folder structure for the dashboard you want to link to. Double-click the dashboard to select it, then click Close and OK.
5.Click File > Save to save the changes. Once a dashboard or component is linked, an ![]() icon will display in the header—click the icon to view and open the linked dashboard.
icon will display in the header—click the icon to view and open the linked dashboard.
To remove a link to another dashboard, open the Linked Dashboards tab, right-click the dashboard or component you want to unlink, and select Remove link.
Exporting
Dashboards are meant primarily for onscreen viewing, but you can export the content into a variety of formats to share with others. Depending on the content type, you can export a dashboard to these formats: Word, PDF, HTML, Excel, CSV, or PowerPoint. To schedule periodic exports, see Scheduling exports.
If needed, you can export single components to 3rd-party applications. For details, see Exporting components to 3rd-party applications.
1.In the dashboard header, click the ![]() icon and select Export to export all onscreen content. To export at the individual component level, click the same icon in the component header. (You may need to click the
icon and select Export to export all onscreen content. To export at the individual component level, click the same icon in the component header. (You may need to click the ![]() icon to view the
icon to view the ![]() icon.)
icon.)
2.The Export dashboard dialog displays with these options:
•Format: Select the file format for the export. If exporting to CSV, multiple components will export as separate CSV files contained in a single downloaded ZIP file.
•Theme: Select the background color to be black or white—this only affects graphics-based content. The white theme helps save on toner when printing.
•Use template: Export to a Word template. (If the content wasn't designed for use with a template, this option is dimmed.)
•Show description: Include a summary of the series, data source, and filter conditions used in the dashboard.
•Show notes: Include any optional notes that are part of this dashboard.
•Show table data: Include data that's presented in tables. As this option can export a lot of data, carefully consider the number of records you'll be exporting.
•Show URL record link: For list components only. Embeds URL links in the exported record list that can open specific records (for example, service desk incidents) in the native application.
3.Click OK to save the item in the Downloads folder defined for your browser. Depending on the type of export, you may be prompted to acknowledge the Save or Open action as displayed by your browser.
You can export dashboards as a screenshot as well. In the dashboard title bar, click the ![]() icon and select Export Screenshot to export all onscreen content. To export at the individual component level, click the same icon in the component header. (You may need to click the
icon and select Export Screenshot to export all onscreen content. To export at the individual component level, click the same icon in the component header. (You may need to click the ![]() icon to view the
icon to view the ![]() icon.)
icon.)
The screenshot will be saved as a .PNG image file in the Downloads folder defined for your browser.
To present a dashboard in a Word document as it appears onscreen, you can export the layout using an Xtraction-generated Word template. Three options are available: Landscape or Portrait, where each component in the layout displays on its own landscape- or portrait-oriented page, and Dashboard, where all components display on a single page. A simple dashboard with fewer panes works best with this last option.
Exporting to a template is a three-step process—first, create and edit the template to your liking; next, upload the template into Xtraction; and finally, export the dashboard content to the template.
To create and edit a template
Before starting, make sure that your dashboard layout is complete and saved.
1.Click the Template > Create > Landscape or Portrait or Dashboard menu.
2.Xtraction creates the template and opens the standard Windows Open/Save dialog.
3.Click Save File, then OK to save the dashboard in the Downloads folder defined for your browser. If you want to edit the template after saving, right-click the DOTX file and select Open to open it. (To ensure that you open the DOTX file and not a DOCX version of the file, don't double-click to open it.)
The template created by Xtraction is simple in layout and contains an image placeholder for each component within the dashboard. Xtraction uses the placeholders to insert the components into the template. Each placeholder has the word TITLE at the top, which is replaced by the source component title when the dashboard is exported.
You're free to modify the template in the following ways:
•Change or delete the Xtraction-generated titles.
•Intersperse the image placeholders anywhere within the document—just don't delete any of them.
To upload the template into Xtraction
1.Click the Template > Upload Template menu.
2.In the Upload dialog, click Select file. Your browser opens a window enabling you to locate the template in your folders.
3.Double-click the file to upload it. Xtraction acknowledges this process by confirming the upload.
4.Click Close.
5.Click File > Save to save the template with the design.
The Template menu also enables you to download a template, provided that one already exists.
To export the content to the template
With the template prepared, uploaded, and saved, export the dashboard content to the template following the "Exporting a dashboard" procedure above. The exported file will save to the default Downloads folder for your browser.