Configuring Services Director
Introduction
You configure Services Director as follows:
•First, you create a collection endpoint. This represents where data for the Splunk system should be sent.
•Then, an analytics profile needs to be creating and applied to a Traffic Manager cluster, so the cluster knows what to export and what collection endpoint to export to.
•Finally, a search endpoint needs to be created so that Services Director can get data from the Splunk system to make graphs.
This chapter describes both CLI and GUI procedures.
Creating a Collection Endpoint
This stage can be completed using the Services Director CLI or GUI. The following properties are required:
•<collection-endpoint> is the FQDN or IP address of your Splunk machine.
•<auth-token> is the token displayed at the end of the procedure for creating a data input for logs, see Creating a Data Input For Logs.
CLI
1.Start the CLI in configuration mode (not the shell), as described in Accessing the Services Director VA CLI and OS Shell.
2.Enter the following CLI command:
ssc collection-endpoint create name Test txn-export-address <collection-endpoint>:5000 txn-tls false log-export-address https://<collection-endpoint>:8088/services/collector/event log-tls-verify false auth-type splunk auth-token <auth-token>
GUI
1.Access your Services Director VA from a browser, using its Service Endpoint IP Address.
2.Log in as the administration user.
The Home page appears.
3.Click the Catalogs menu, and then click Analytics > Analytics Endpoints.
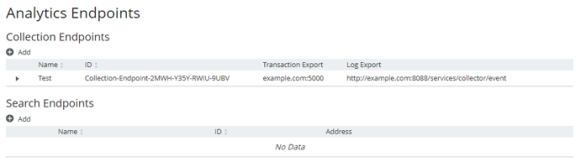
The Analytics Endpoints page appears. For example: Refer to the Collection Endpoints figure.
4.Click the Add button above the Collection Endpoints table.
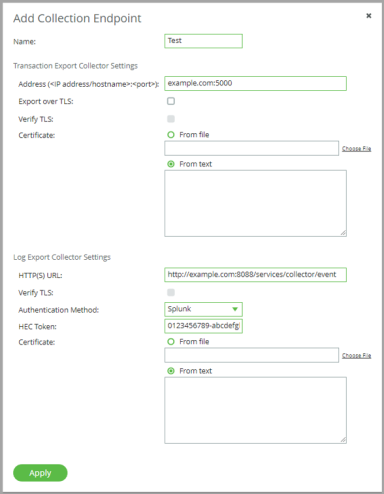
The Add Collection Endpoint dialog box appears.
5.Complete the following fields:
•Name: Test. This name will appear in the Collection Endpoints table after you apply the endpoint.
•Under Transaction Export Collector Settings:
•Address: <collection-endpoint>:5000
•Under Log Export Collector Settings:
•Address: https://<collection-endpoint>:8088/services/collector/event
•Authentication Method: Splunk
•HEC Token: <auth-token>
Leave all other fields with their default values. For example:
6.Click Apply.
The collection endpoint is added to the Collection Endpoint table. For example:
Creating and Applying an Analytics Profile
This stage can be completed using the Services Director CLI or GUI.
The following properties are required:
•<logs_export_list> is a comma-separated list of log IDs. For example:
"Audit Log","Event Log","System - authentication log"
•<cluster-name> is the name or ID of the target Traffic Manager cluster.
CLI
1.Start the CLI in configuration mode (not the shell), as described in Accessing the Services Director VA CLI and OS Shell.
2.Create an analytics profile:
ssc analytics-profile create logs-to-export <logs_export_list> tag Test
3.Apply the analytics profile to an analytics cluster:
ssc cluster update cluster-name <cluster_name> analytics-profile Test
GUI
1.Access your Services Director VA from a browser, using its Service Endpoint IP Address.
2.Log in as the administration user. The Home page appears.
3.Click the Catalogs menu, and then click Analytics > Analytics Profiles.
The Analytics Profiles page appears. For example:
![]()
4.Click the Add button above the table.
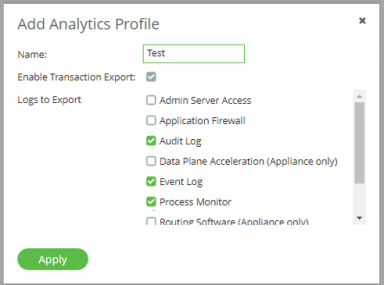
5.In the Add Analytics Profile dialog, complete the following fields:
•Name: Test
•Enable Transaction Export: Select this check box.
•Logs to Export: Check one or more of the listed logs.
For example:
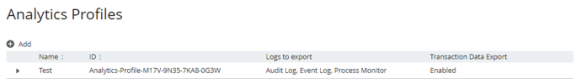
6.Click Apply.
The profile is added to the Analytics Profile page. For example:
7.Click the Services menu, and then click Services Director > vTM Clusters.
The vTM Clusters page appears. For example:
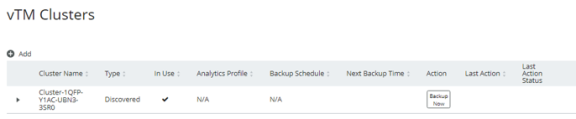
8.Expand the cluster entry corresponding to your registered Traffic Manager.
9.In the expanded view, set Analytics Profile to Test. For example:
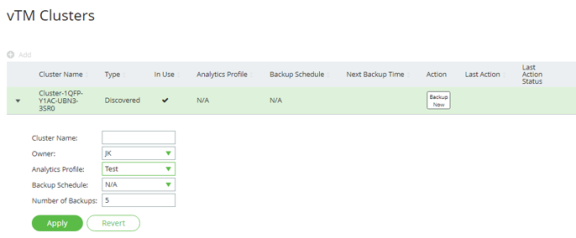
10.Click Apply.
Creating a Search Endpoint
This stage can be completed using the Services Director CLI or GUI. The following properties are required:
•<search-endpoint> is the FQDN or IP address of your Splunk machine.
•<auth-password> is the password required to log into the Splunk system.
After completing this stage, you should be able to log into the Services Director GUI and access exported analytics data in the vADC Analytics application.
CLI
1.Start the CLI in configuration mode (not the shell), as described in Accessing the Services Director VA CLI and OS Shell.
2.Create a search endpoint:
ssc search-endpoint create search-endpoint address <search-endpoint>:8089 use-tls true name Test auth-username admin auth-password <auth-password> logs-index zxtm_logs transactions-index zxtm_transactions
GUI
1.Access your Services Director VA from a browser, using its Service Endpoint IP Address.
2.Log in as the administration user. The Home page appears.
3.Click the Catalogs menu, and then click Analytics > Analytics Endpoints.
The Analytics Endpoints page appears. For example:
![]()
4.Click the Add button above the Search Endpoints table.
The Add Search Endpoint dialog box appears.
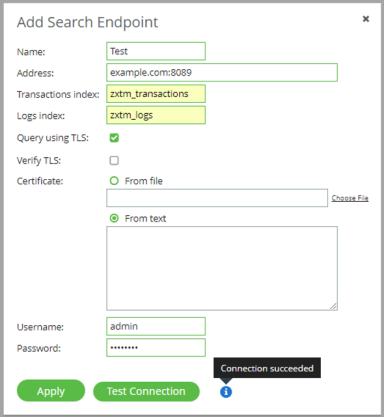
5.Complete the following fields:
•Name: Test. This name will appear in the Search Endpoints table after you apply the endpoint.
•Address: <collection-endpoint>:8089
•Transactions index: zxtm_transactions
•Logs index: zxtm_logs
•Query using TLS: Select this check box.
•Username: admin
•Password: <auth-password>
Leave all other fields with their default values.
6.Click Test Connection. You should see a "Connection succeeded" message.
If you see a warning about no data being found, check that the Splunk system's indexes exist and have received data.
For example:
7.Click Apply.
The search endpoint is added to the Search Endpoint table. For example:
