Viewing Alerts
The Alerts page provides the following information about each alert that has been generated on your network. View alerts by clicking the Alerts tab. The Alert Log panel shows any alerts associated with the folder or region selected in the navigation tree. The following information is displayed for each alert:
|
Status |
Whether the alert has been acknowledged or not. |
|
Severity |
Displays the severity type of the alert. |
|
Source |
The server that generated the alert. |
|
Name |
The device that generated the alert. This field is empty for system alerts. |
|
Folder |
Displays the folder where the event occurred. |
|
Timestamp |
The date and time when the event occurred. |
|
Description |
Provides a brief description of the event. |
When a new alert is generated, it appears in the Alerts tab and on the map. In the Alerts tab, the alert is listed in the Alert Log panel. In the Maps tab, the folder where the alert was generated is outlined in the color of the most severe alert at that folder. Acknowledging the alert will remove the colored indicator from the map
For information about configuring which events trigger an alert, see Creating and Configuring Alert Profiles.
Customizing the Alerts Page
The System Settings page allows you to configure the way the Alerts page manages and displays alerts. You can configure the following settings:
•Number of days an alert is displayed in the Current Alerts panel.
•The number of alerts to display.
•Maximum number of alerts to store. Alerts are stored in the database on the Enterprise Server. This option is only available for administrative users.
To customize the Alerts tab functions
1.Click Tools > System Settings.
The System Settings page appears.
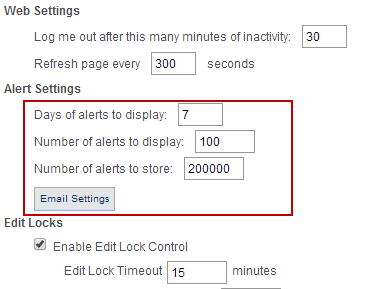
2.Under Alert Settings, use the Days of alerts to display, Number of alerts to display, and Number of alerts to store boxes to configure the alert settings.
3.Save your changes.
The Alerts page will update to reflect your changes.
You can also configure alerts to go to your email. For more information, see Configuring Alert Emails.