Viewing and configuring dashboards
Click the required dashboard from the Dashboards menu sub-options under Reporting on the menu bar to view or configure it.
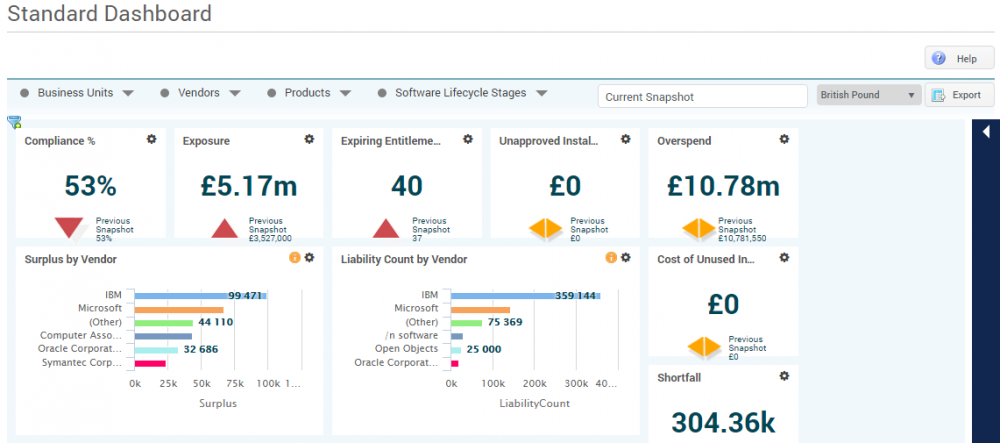
The name of the selected dashboard appears at the top of the page. You can filter data on the dashboard page using the filter bar below the dashboard name. For more information, see Viewing pages of data.

Tiles on the dashboard that have their own customized filters are not affected by filtering at this level.
Time frames
You can specify the time frame used in the information displayed on the page using the time frame pane.
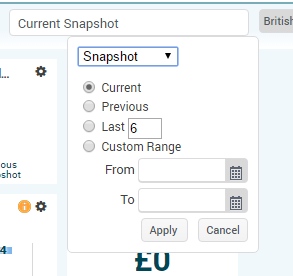
To select a time frame:
1.Select Month or Snapshot (for reconciliations) from the drop-down list at the top of the pane.
2.Select the required option button to set the time frame.
If you select Custom Range, specify a From and To for the date range.
3.Click Apply.
The dashboard refreshes using data from the new time frame parameters.
Currency
Specify the currency you want to use on the Dashboard page from the Currency drop-down list.
Exporting dashboard reports
Click Export to generate a PDF containing the view shown on the dashboard page.
Tiles pane
You can re-size tiles by clicking and dragging the corners of the tile and re-positioned them by clicking and dragging them.
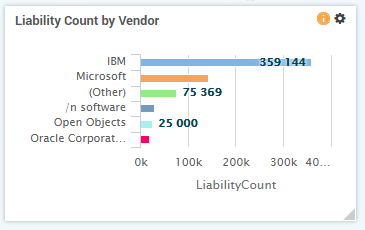
Each tile contains a title, a graph displaying the tile data, a gears menu icon at the top right of the tile, and a trash can icon. Clicking the gears menu icon displays the Edit Tile page for the selected tile (see below). The trash can icon appears only on tiles that you are allowed to remove from the dashboard.
Any tiles with filtering restrictions also display a yellow Information icon next to the gears menu. Hover over this icon to display the filtering restrictions relating to the tile.
Clicking a tile displays the Tile Drill-down page for the selected tile. For more information, see Tile drill-down pages.
Adding tiles
You can add new tiles to a dashboard from the pane on the right of the dashboard that appears when you click ![]() .
.
To add a tile:
1.Click the Expand Pane arrow on the blue bar at the right of the page.
The Add Tiles pane appears.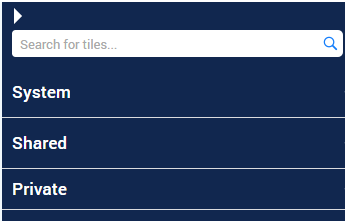
2.Expand the group you require:
System – tiles that have been created by Ivanti and are provided with License Optimizer
Shared – tiles that have been created by colleagues as a shared tile
Private – tiles that you created for your own use
3.Expand the required folders, then click the green plus icon alongside the required tile.
The tile is added to the dashboard and can then be moved or resized.
If the tile already appears on the dashboard, the green plus icon is grayed out.
You can also search for tiles using the Search for tiles box at the top of the pane.
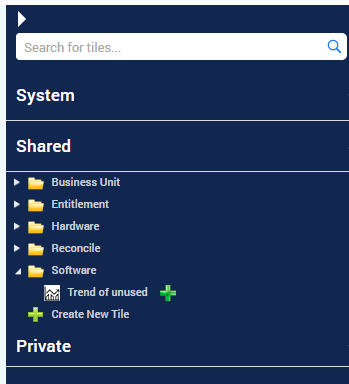
You can create a new tile from the Shared and Private sections of the Add Tiles pane by clicking Create New Tile. The Add Tile page appears, enabling you to configure a new tile. The Add Tile page is configured in the same way as the Edit Tile page, described below.
Editing tiles
Clicking Help at the top of the Add Tile page displays help icons alongside certain areas of the page. Clicking these help icons displays brief help for the area of the page.
To edit a tile:
1.Click the gears menu icon at the top right of the tile to edit it.
If you are not allowed to edit the selected tile directly, a message appears that includes a Create a Copy button so that you can create a copy of the tile for editing.
2.On the Details tab, enter a Tile Title and set the Sharing permissions to either Private or Shared (see above).
3.Click the Primary Series tab.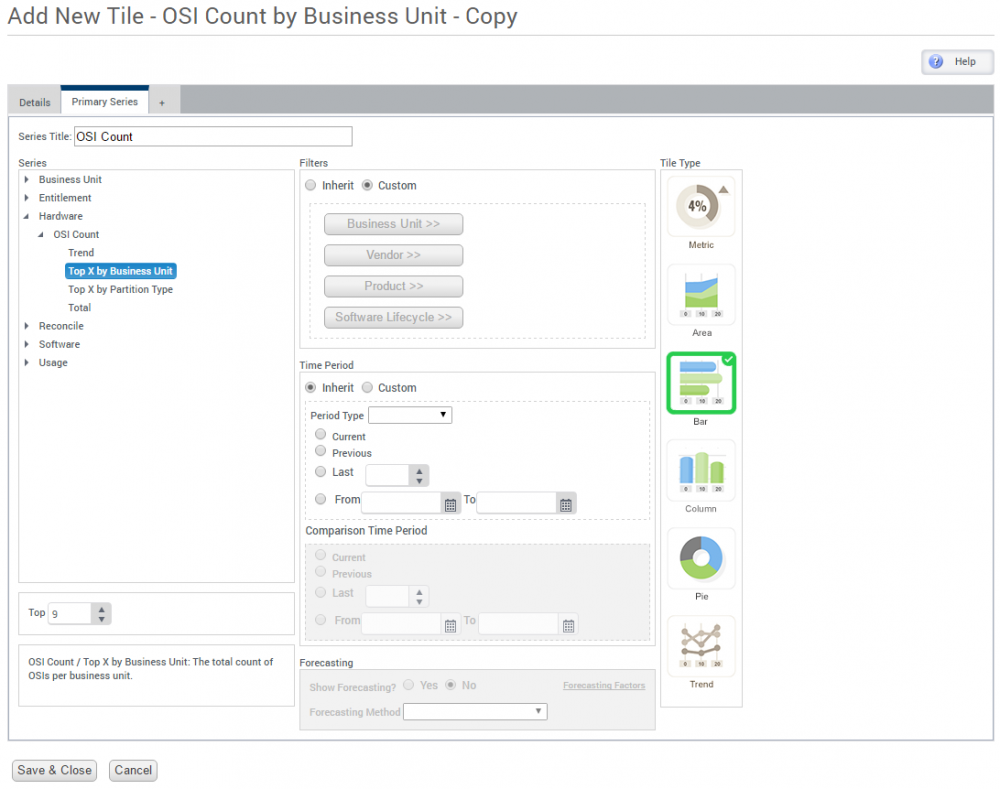
4.Specify a title for the series in the Series Title box.
5.Select the data series you want to appear in the graph from the Series list.
The data series are organized by category (Business Unit, Entitlement, Hardware, Reconcile, Software, and Usage), and subdivided by type. A description of the selected series appears at the bottom of the tab.
6.If you choose a Top X data series, specify the value of X in the section below the Series list.
Selecting a data series determines the tile types available in the Tile Type section. For example, you cannot display a trend data series in a pie-chart tile type. Unavailable options are grayed out.
Selecting a data series also determines the tile-level filters that can be applied in the Filters section.
Applying a tile-level filter overrides any page-level filters applied on the Dashboard page.
7.Specify the Time Period.
Certain time periods are not available for all data series. For example, you cannot choose the current snapshot timeframe with a Tile Type of Trend.
8.For metric or trend data series types, the Forecasting section is available. Select Yes in the Forecasting group adds a second series line showing the forecast data. The forecast data uses a dedicated algorithm based on the forecasting method plus any user-input forecasting measures License Optimizer learns heuristically and results increase in accuracy as more data is added over time. For more information, see Forecasting Factors.
9.Select the Forecasting Method from the drop-down list.
Different methods return differing levels of accuracy for data. Use trial-and-error to determine the most accurate method for the particular data series.
10.When you have edited the tile as required, click Save & Close to save the changes and return to the Dashboard page.