Navigation
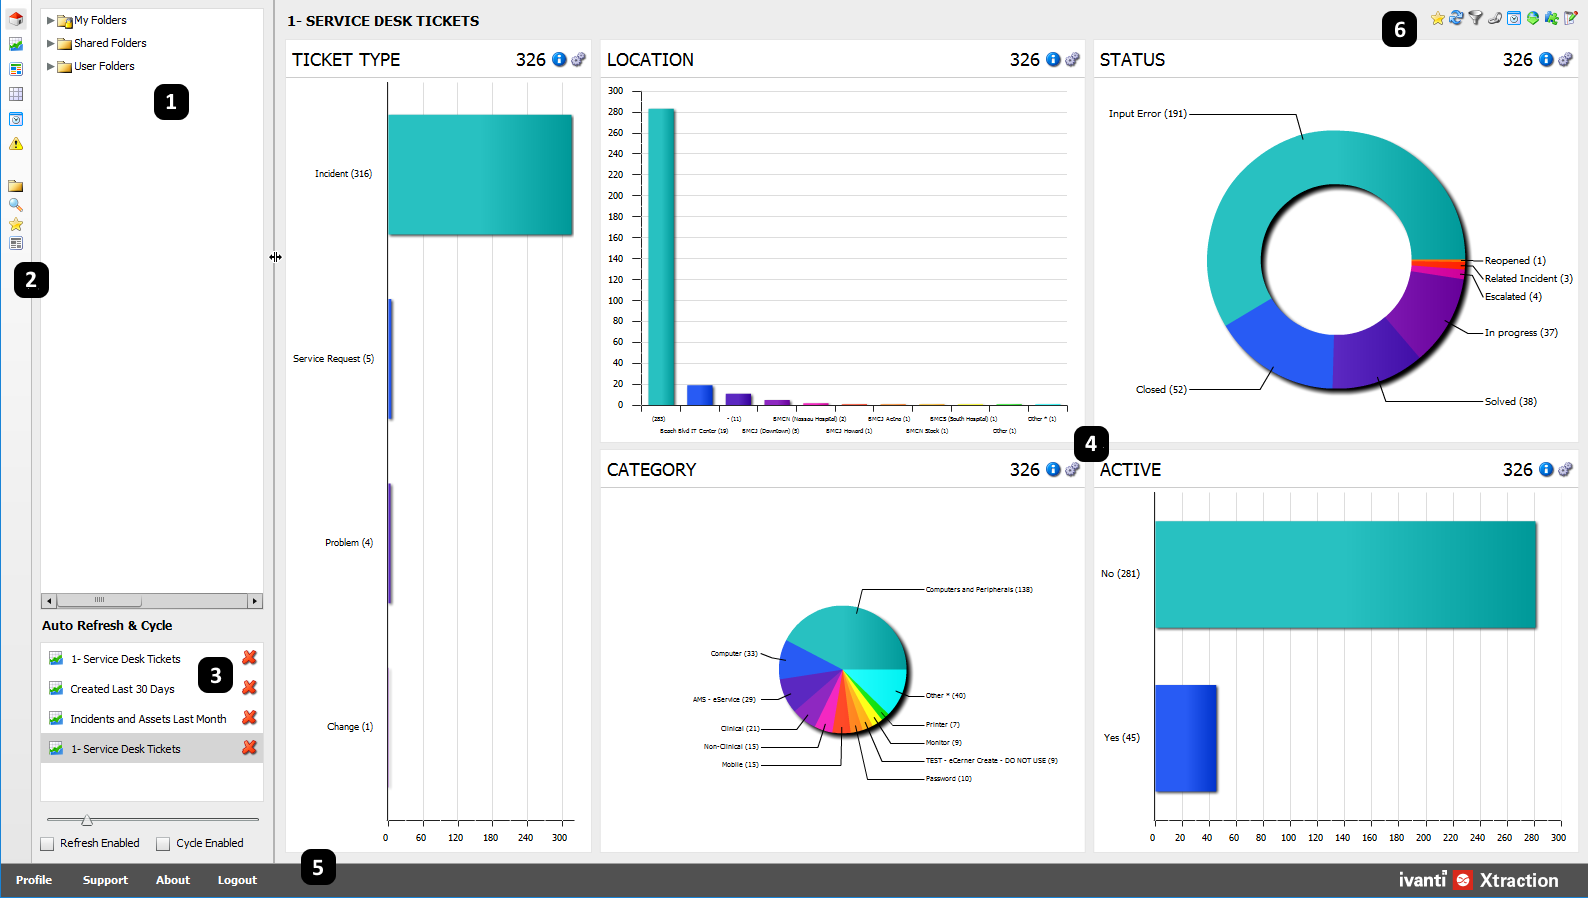
The Xtraction web client is made of the following interactive areas. Read more about these areas below:
This pane contains a folder structure of all saved dashboards, documents, filters, and reports. If an item, such as a document, requires you to enter parameters before opening, a prompt will display.
Displayed folders are determined by your access rights. You can always see your personal content, plus any content designated as shared by its designer or the administrator.
To the left of the navigation pane is the Xtraction toolbox. The icons that display depend on your access rights. The full set of icons is as follows:
•
![]() – Returns you to the main page to view personal and shared content.
– Returns you to the main page to view personal and shared content.
•
![]() – Opens the Dashboard Designer (designer rights required).
– Opens the Dashboard Designer (designer rights required).
•
![]() – Opens the Document Designer (designer rights required).
– Opens the Document Designer (designer rights required).
•
![]() – Opens the Report Designer (designer rights required).
– Opens the Report Designer (designer rights required).
•
![]() – Opens the Scheduled task page, where you can manage scheduled exports for dashboards, documents, and reports (enterprise designer or scheduler rights required).
– Opens the Scheduled task page, where you can manage scheduled exports for dashboards, documents, and reports (enterprise designer or scheduler rights required).
•
![]() – Opens the Alerts list page, where you can define notifications to track data-status changes (alert user rights required).
– Opens the Alerts list page, where you can define notifications to track data-status changes (alert user rights required).
•
![]() – Opens the Open dialog, where you can navigate the folder structure to open saved dashboards, documents, and filters.
– Opens the Open dialog, where you can navigate the folder structure to open saved dashboards, documents, and filters.
•
![]() – Opens the Open dialog to enable a search for specific content.
– Opens the Open dialog to enable a search for specific content.
•
![]() – Opens the Open dialog, where you can select and manage favorite folders and objects.
– Opens the Open dialog, where you can select and manage favorite folders and objects.
•
![]() – Opens the Stored Reports dialog, where you can select from a list of stored custom reports.
– Opens the Stored Reports dialog, where you can select from a list of stored custom reports.
Note that you can:
•Click the sidebar to collapse or expand the navigation pane.
•Change the width of the navigation pane by dragging the dividing line.
A display area for adding favorite dashboards or documents that you want to access quickly. You can enable Xtraction to refresh these items at set intervals or cycle through them for display.
If you've defined a default Favorites folder, items in that folder will automatically load on startup into the Auto Refresh & Cycle list. For details about Favorites folders, see "Storing items as favorites" below.
To set up an Auto Refresh & Cycle list
1.Click the ![]() toolbox icon to view the Auto Refresh & Cycle list.
toolbox icon to view the Auto Refresh & Cycle list.
2.In the navigation pane, navigate the folder structure to locate an object to add to this list.
3.Drag and drop the object into the Auto Refresh & Cycle list.
4.Use the slider to set the refresh interval between 10 seconds and ten minutes.
5.Click Refresh Enabled to refresh each currently displayed object at regular intervals.
6.Click Cycle Enabled to force Xtraction to cycle through the list and display each object in turn.
To remove an object from this list, click the  icon. Right-click anywhere in Auto Refresh & Cycle, and select Clear Items to clear the whole list.
The work area where you will create a dashboard, document, or report, depending on the designer tool selected in the toolbox:
•Dashboards: Present content in interactive dashboards using graphs, charts, lists, and images. The design canvas is made of distinct panes as specified by your dashboard layout. By dropping one component into each pane, you can assemble the content in a variety of ways. For details, see Dashboard Designer.
•Documents: Present content in the format of a printable report when the screen limitations of a dashboard aren't sufficient. If needed, you can use a predefined template to customize the output for Word files. For details, see Document Designer.
•Reports: An advanced user can create reports by running standard SQL statements directly against a target data source. For details, see Report Designer.
Use this set of links to perform additional actions. Displayed links are determined by your access rights.
Click the Profile link to manage the following user settings:
•Reload folder structure: Return the folders list to the initial display.
•Large display mode: Change the font size for dashboard and component titles to provide better viewing on large displays.
•Change password: Change your Xtraction password for local authentication. Note that you can't change a Windows authentication password from within Xtraction.
•Settings: Change the time zone, language used in the user interface, the default columns that display for list components, and variable values for viewing content (if the administrator has set up editable variables for you). Note that for the time zone, Xtraction displays data in the context of the zone set for each user; if you're traveling to a different location, or need to access data in the context of that location, this is where you set the new time zone.
When changing user-profile options, you may need to clear your cache and log in again before the new settings are applied.
Use these icons to perform certain actions on content in the design canvas. Dashboards always display all available icons, but the set is limited by your access rights. The full set includes the following:
•
![]() – Opens the content in edit mode.
– Opens the content in edit mode.
•
![]() – Displays properties of the content.
– Displays properties of the content.
•
![]() – Displays a summary sheet of each component within the dashboard or document.
– Displays a summary sheet of each component within the dashboard or document.
•
![]() – Displays any notes that have been added about the content.
– Displays any notes that have been added about the content.
•
![]() – Exports content to a file format or to a PNG file as a screenshot.
– Exports content to a file format or to a PNG file as a screenshot.
•
![]() – Enables you to schedule content exports.
– Enables you to schedule content exports.
•
![]() – Copies a link for the current content to the clipboard.
– Copies a link for the current content to the clipboard.
•
![]() – Opens a menu with filter options for dashboards and documents.
– Opens a menu with filter options for dashboards and documents.
•
![]() – Refreshes the status of the display.
– Refreshes the status of the display.
•
![]() – For dashboards only. Add a dashboard to a new or existing Favorites folder.
– For dashboards only. Add a dashboard to a new or existing Favorites folder.
•
![]() – For reports only. Enter or edit any parameters that the report may rely on, then refresh the display.
– For reports only. Enter or edit any parameters that the report may rely on, then refresh the display.
Action icons for component displays
Each component within a display includes its own set of icons that enable you to perform certain actions. The icons display at the top of the component header. The full set includes the following:
•
![]() – Toggles the main action icons, which are hidden by default.
– Toggles the main action icons, which are hidden by default.
•
![]() – Exports content to a file format or to a PNG file as a screenshot.
– Exports content to a file format or to a PNG file as a screenshot.
•
![]() – Opens a menu of other formats for displaying the component type.
– Opens a menu of other formats for displaying the component type.
•
![]() – Clears all temporary filters from the component.
– Clears all temporary filters from the component.
•
![]() – Displays properties of the component.
– Displays properties of the component.
•
![]() – Displays any notes that have been added about the component.
– Displays any notes that have been added about the component.
•
![]() – When present, displays the total number of detailed records underlying the component.
– When present, displays the total number of detailed records underlying the component.
Storing items as favorites
You can store regularly viewed items in one or more named Favorites folders. By selecting a folder as the default, the contained items will load on startup into the Auto Refresh & Cycle list for easy access.
1.Click the ![]() toolbox icon, then click the
toolbox icon, then click the ![]() toolbox icon.
toolbox icon.
2.In the Open dialog, right-click in the left panel and select Add Favorite Folder.
3.Enter a folder name and select if you want to make it the default. The default folder loads on startup into the Auto Refresh & Cycle list and is marked with an asterisk (*) in the Open dialog. Click OK.
4.Right-click any folder in the list to edit, delete, and set or clear as the default.
5.Click Close.
After creating a Favorites folder, you can add dashboards, documents, and reports to it one of two ways:
To add favorites via a dashboard or document header
1.In the header of an open dashboard or document, click the ![]() icon.
icon.
2.Select an existing Favorites folder to add this item to, or create a new folder if needed.
3.Click OK.
To add favorites via Auto Refresh & Cycle
You must first build a list of items in the Auto Refresh & Cycle list. For details, see "Auto Refresh & Cycle" above.
1.Right-click in the Auto Refresh & Cycle list and select Save As Favorite to save the entire list as a favorite.
2.In the Save Favorites dialog, select an existing Favorites folder or create a new one. Selecting an existing Favorites folder will overwrite existing favorites contained within it.
3.Click OK.
1.Click the ![]() toolbox icon, then click the
toolbox icon, then click the ![]() toolbox icon.
toolbox icon.
2.In the Open dialog, click the ![]() icon to view the list of Favorites folders.
icon to view the list of Favorites folders.
3.Click a folder to view its contained items. To open an item in the design canvas, double-click it.