Document Designer
You must have designer rights to create and edit documents.
Use the Document Designer to present data in the format of a report when the screen limitations of a dashboard aren't sufficient. A document works better than a dashboard if you're creating a weekly or monthly report that contains dozens of charts, graphs, or lists that run to multiple pages (Word or PDF files), tabs (Excel spreadsheets), or slides (PowerPoint presentations). As with dashboards, you can export documents in a variety of formats for sending via email to key stakeholders.
When using the Document Designer, you have the left navigation pane, as well as the design canvas that displays two distinct sub-panes:
•The central pane graphically displays one component at a time that's included in the document.
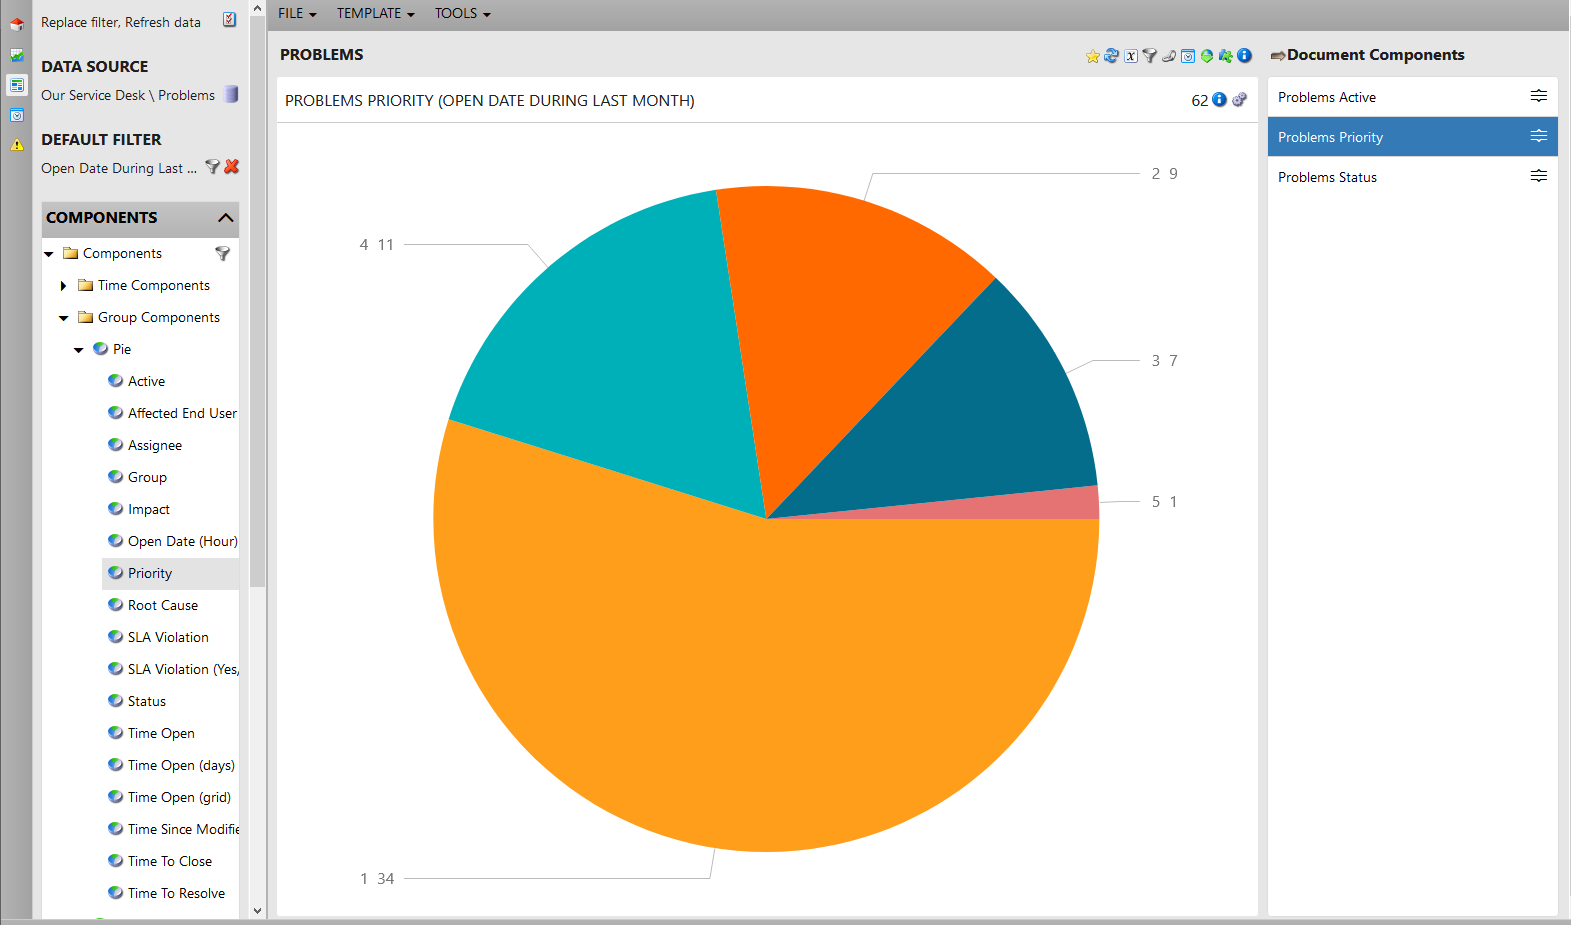
•The right pane lists all components included in the document composition. Click any one of the listed components to display it individually in the central pane. You can include any number of components of any type in a document, because you're not constrained by screen real estate.
Getting started
Open the Document Designer by clicking the ![]() icon in the toolbox. To get started, use the same method as detailed for creating a dashboard:
icon in the toolbox. To get started, use the same method as detailed for creating a dashboard:
•In the navigation pane, select the data-source target and define any optional filters. For details about using filters, see Filters.
•Expand the components list in the navigation pane, then drag and drop components onto the central pane. It doesn't matter if a component is already displayed; dragging another one to that area adds it to the composition. Continue adding components to the central pane until you have a complete document. For details about components, see About components.
•Click a component in the right pane to bring it into focus in the central pane. Use action icons in the header to interact with a displayed component and tailor its design settings. Click a single data point to apply temporary filters or view an underlying record list. For details about these interactive features, see Dashboard Designer.
•Use the Tools menu to incorporate any filters or saved dashboards.
•To sort components in the right pane, use the  icon to move a component up or down the list. Right-click a component to edit, copy, or remove it.
•When your design is complete, click the File > Save menu. To export the document, see the procedures below.
Adding parameters
You can include parameters in a document that prompt a user to fill in values before they can view the content. The parameters filter the data, enabling a user to run the same report with different values to obtain varying results. For example, if a document shows all open incidents, you could set up parameters that filter the data by incident Priority and Assignee.
Adding parameters to a document is a two-procedure process—first you add the parameter, then you create a new filter condition that references the parameter in the document.
For additional guidance, see the Document Parameters video on the Ivanti community website.
This procedure assumes you're working with a previously saved document.
1.With a document open, click the ![]() icon in the document header (don't confuse this with the header of an open component).
icon in the document header (don't confuse this with the header of an open component).
2.In the Document dialog, click the Parameters tab.
3.Right-click the blank area and select Add parameter.
4.In the Parameter dialog, enter the parameter details: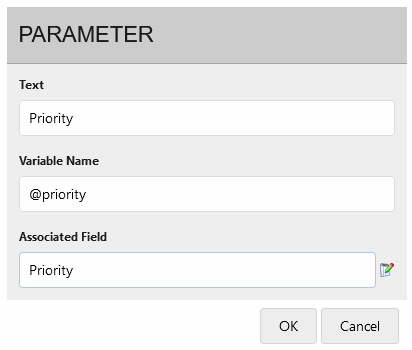
•Text: A title that displays to the user when prompted for a parameter value. (The image below shows what the user will see: two parameters titled "Priority" and "Assignee.")
•Variable name: A variable to be associated with this parameter. You can name variables any way you want, just be consistent with your naming conventions.
•Associated field: A field from the data source that prompts a user to select from a list of potential values (recommended). If no field is associated, users will be presented with a text field for entering a value. Click the ![]() icon. First ensure that the correct data source is selected, then select a field from the list. (In the image above, the parameter titled "Priority" is associated with a field of the same name. In this particular data source, the Priority field contains the values of 1–5 that a user will be able to select from.)
icon. First ensure that the correct data source is selected, then select a field from the list. (In the image above, the parameter titled "Priority" is associated with a field of the same name. In this particular data source, the Priority field contains the values of 1–5 that a user will be able to select from.)
5.Click OK, then OK again. The ![]() icon will display in the document header indicating that a parameter is now added.
icon will display in the document header indicating that a parameter is now added.
6.Click the ![]() icon to open the Parameters dialog. Click the button at the end of each row to select from a list of values pulled from the associated field. (In the image below, selected values are "5" and "Addie Munch.") Click OK. Each time the document is opened, the Parameters dialog will display and prompt the user to select a value for each listed parameter.
icon to open the Parameters dialog. Click the button at the end of each row to select from a list of values pulled from the associated field. (In the image below, selected values are "5" and "Addie Munch.") Click OK. Each time the document is opened, the Parameters dialog will display and prompt the user to select a value for each listed parameter.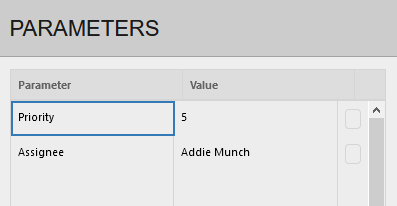
Complete the next procedure to create a filter condition for each parameter value.
1.With the document open, bring one of the components into focus in the central pane.
2.Click the ![]() icon in the component header, then select the component name (seen as "Number" in the image below).
icon in the component header, then select the component name (seen as "Number" in the image below).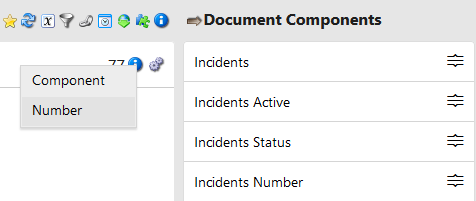
3.In the Component Series dialog, click the Filter tab, then right-click in the Conditions area and select Add Variable Conditions.
4.In the Add Variable Conditions dialog, select the field to filter on, an operation (such as "equals"), and the variable created above. Click Add Condition.
5.Click OK, then OK again. The document component in the central pane will update with the values you selected in the Parameters dialog. Change the values by selecting new ones in the Parameters dialog.
6.Click the File > Save menu.
Exporting
You can export documents to these formats: Word, PDF, HTML, Excel, or PowerPoint. To schedule periodic exports, see Scheduled exports.
1.In the document header, click the ![]() icon to export all components that comprise the document. To export at the individual component level, click the same icon in the header of the in-focus component. (You may need to click the
icon to export all components that comprise the document. To export at the individual component level, click the same icon in the header of the in-focus component. (You may need to click the ![]() icon to display the
icon to display the ![]() icon.)
icon.)
2.In the Export Document dialog, set the following options: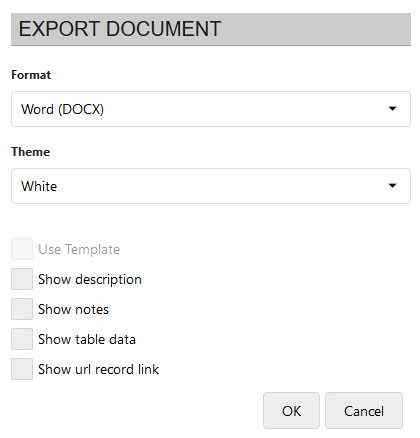
•Format: Select the file format for the export. If exporting to HTML, the file will export to a .ZIP file instead of displaying onscreen.
•Theme: Select the overall background color to be black or white. The white theme helps save on toner when printing.
•Use template: Export to a Word template. (If the content wasn't designed for use with a template, this option is dimmed.)
•Show description: Include a summary of the series, data source, and filter conditions used in the content.
•Show notes: Include any of the optional notes that are part of this document.
•Show table data: Include data that's presented in tables. As this option can export a lot of data, carefully consider the number of records you'll be exporting.
•Show URL record link: For list components only. Embeds URL links in the exported record list that can open specific records (such as service desk incidents) in the native application.
3.Click OK.
4.Click Save File, then OK to save the file in the Downloads folder defined for your browser.
If exporting to a Word file, you can customize the formatting of a document with an Xtraction-generated Word template. To do so, complete a three-procedure process—first create and edit the template to your liking, next upload the template into Xtraction, and finally export the document content to the template.
Before exporting, make sure that your document composition is complete, contains all components to be included in the result, and has been saved.
To create and edit a template
1.Click the Template > Create > Landscape or Portrait menu.
2.Xtraction creates the template and opens the standard Windows Open/Save dialog.
3.Click Save File, then OK to save the file in the Downloads folder defined for your browser. If you want to edit the template after saving, right-click the DOTX file and select Open to open it. (To ensure that you open the DOTX file and not a DOCX version of the file, don't double-click to open it.)
The template created by Xtraction is simple in layout, with one table in the template for each component within the document. The tables do not have outlines; however, you can select an entire table to see the extent of it by clicking the ![]() icon in the top-left corner.
icon in the top-left corner.
Each table contains hidden metadata that enables Xtraction to insert components into the template. Each table has the word TITLE in the top row, which will be replaced by the source component title when the document is exported (components are exported in top-down order from the document components list). You have the freedom to tailor the template, but for a successful export, ensure that the tables remain fully intact within the final document.
Some of your formatting options include:
•Changing or deleting the Xtraction-generated titles.
•Interspersing the Xtraction picture placeholders anywhere within an existing document.
To upload the template into Xtraction
1.Click the Template > Upload Template menu. Your browser will open a window enabling you to locate the template in your folders.
2.Double-click the document and click Upload. Xtraction acknowledges this process by confirming the upload.
3.Click the File > Save menu to save the template with the design.
The Template menu also enables you to download a template, provided that one already exists.
Once the template is uploaded and saved, you can then export the document content. For details, see the procedure above "To export a document."