Dashboard Designer
You must have designer rights to create and edit dashboards.
The Dashboard Designer enables you to create working dashboards that provide real-time access to the data needed for your daily tasks. Use this tool to perform ad-hoc analyses of data when existing reports aren't adequate (and you don't have time to build new ones) and to schedule regular exports of data in a variety of formats for sending via email to key stakeholders.
The Dashboard Designer is simple to use—choose a layout, select a data source, add filters, and then drag and drop various components onto the design canvas. As you build a dashboard, you'll receive instant feedback from the data and can immediately interact with various data points.
When you need to present a large amount of data as a report that doesn't fit well onto a single screen, a document works better than a dashboard. In that case, use Xtraction's Document Designer tool. For details, see Document Designer.
Creating a basic dashboard
The following procedure leads you though the process of creating a basic dashboard. Before starting, you may want to read about:
•Navigating the user interface. For details, see Navigation.
•Using components in dashboards. For details, see About components.
•Filtering dashboard content. For details, see Filters.
1.Open the Dashboard Designer by clicking the ![]() toolbox icon left of the navigation pane.
toolbox icon left of the navigation pane.
2.In the top menu bar, click File > New to open the Dashboard dialog.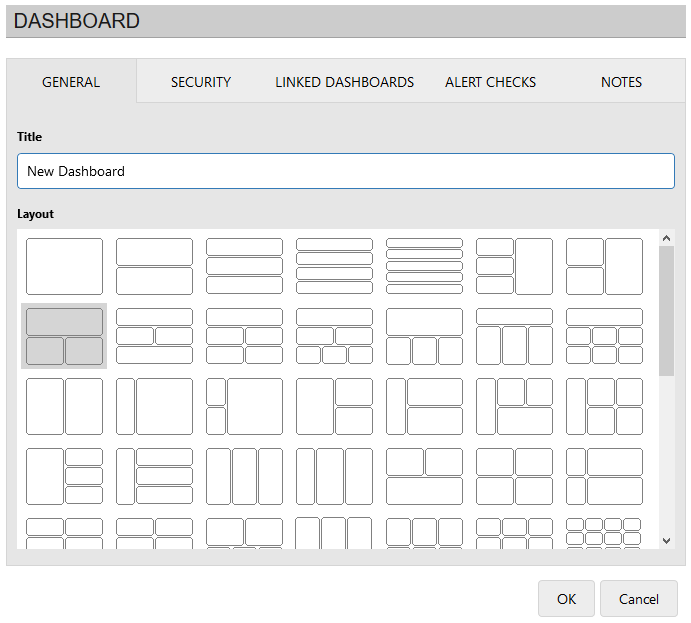
3.Under the General tab, enter a descriptive title for the dashboard. Also select the layout for how this dashboard will display in the design canvas. Generally, the default one-over-two pane layout is recommended. Each pane in the layout can contain one component. After selecting a layout, you can change it at any point without ruining your existing dashboard.
For a simple dashboard, none of other tabs in this dialog are necessary. For details about the other tabs, such setting up an alert to monitor data-status updates, see Properties, alerts, and defaults. Click OK.
4.To select a data source to report against, click the ![]() icon in the left navigation pane. In the Select Data Source dialog, scroll down the list of available data sources and find one to connect to. Expand the data source and select a "view" for this dashboard (in the image below, that would be "Incidents"). Click OK. The navigation pane updates to display the data source and view you selected.
icon in the left navigation pane. In the Select Data Source dialog, scroll down the list of available data sources and find one to connect to. Expand the data source and select a "view" for this dashboard (in the image below, that would be "Incidents"). Click OK. The navigation pane updates to display the data source and view you selected.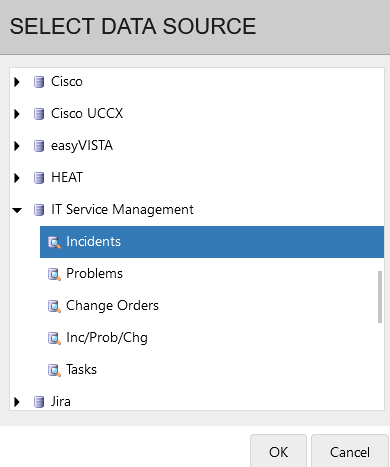
5.In the navigation pane, you'll notice that in most cases a Default Filter is loaded to reduce the viewable data to the last calendar month. For this procedure, you can leave the default filter as is, or you can add a filter condition to it to further narrow the data results:
•Let's assume you're creating a dashboard for service desk incidents, and you want to see only one group's assigned tickets for the last month. To add a filter condition:
•Click the Default Filter ![]() icon. In the Edit Filter dialog, right-click in the blank area and select Add Condition(s). For the field, select Group, then Equals, then search for and add a group's name as a value (such as "MAC Support" in the image below).
icon. In the Edit Filter dialog, right-click in the blank area and select Add Condition(s). For the field, select Group, then Equals, then search for and add a group's name as a value (such as "MAC Support" in the image below). 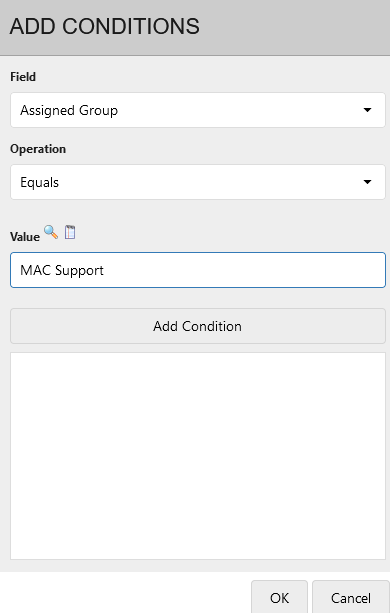
•Click OK. You'll notice that in the Edit Filter dialog, your new filter condition now displays. Click OK.
•The default filter in the navigation pane updates to display the condition you just entered. Now, when you drag and drop a component over to a pane in the design canvas, only the data that meets the filter condition will display.
•As you become familiar with Xtraction, you'll want to learn more about how to effectively use filters to narrow the viewable data. For details, see Filters.
6.Now you're ready to add components to the empty panes of your dashboard layout:
• Scroll down and expand the navigation pane's components list until you find data that you want to view in the form of graphs, charts, and more.
•Drag and drop a component into one of the panes of your dashboard. Each pane can contain one component. To change the data in a pane, drag and drop a new component on top of the current one. When replacing a component, ensure that you release your cursor in the pane and not on the pane's header, which will cause the action to fail.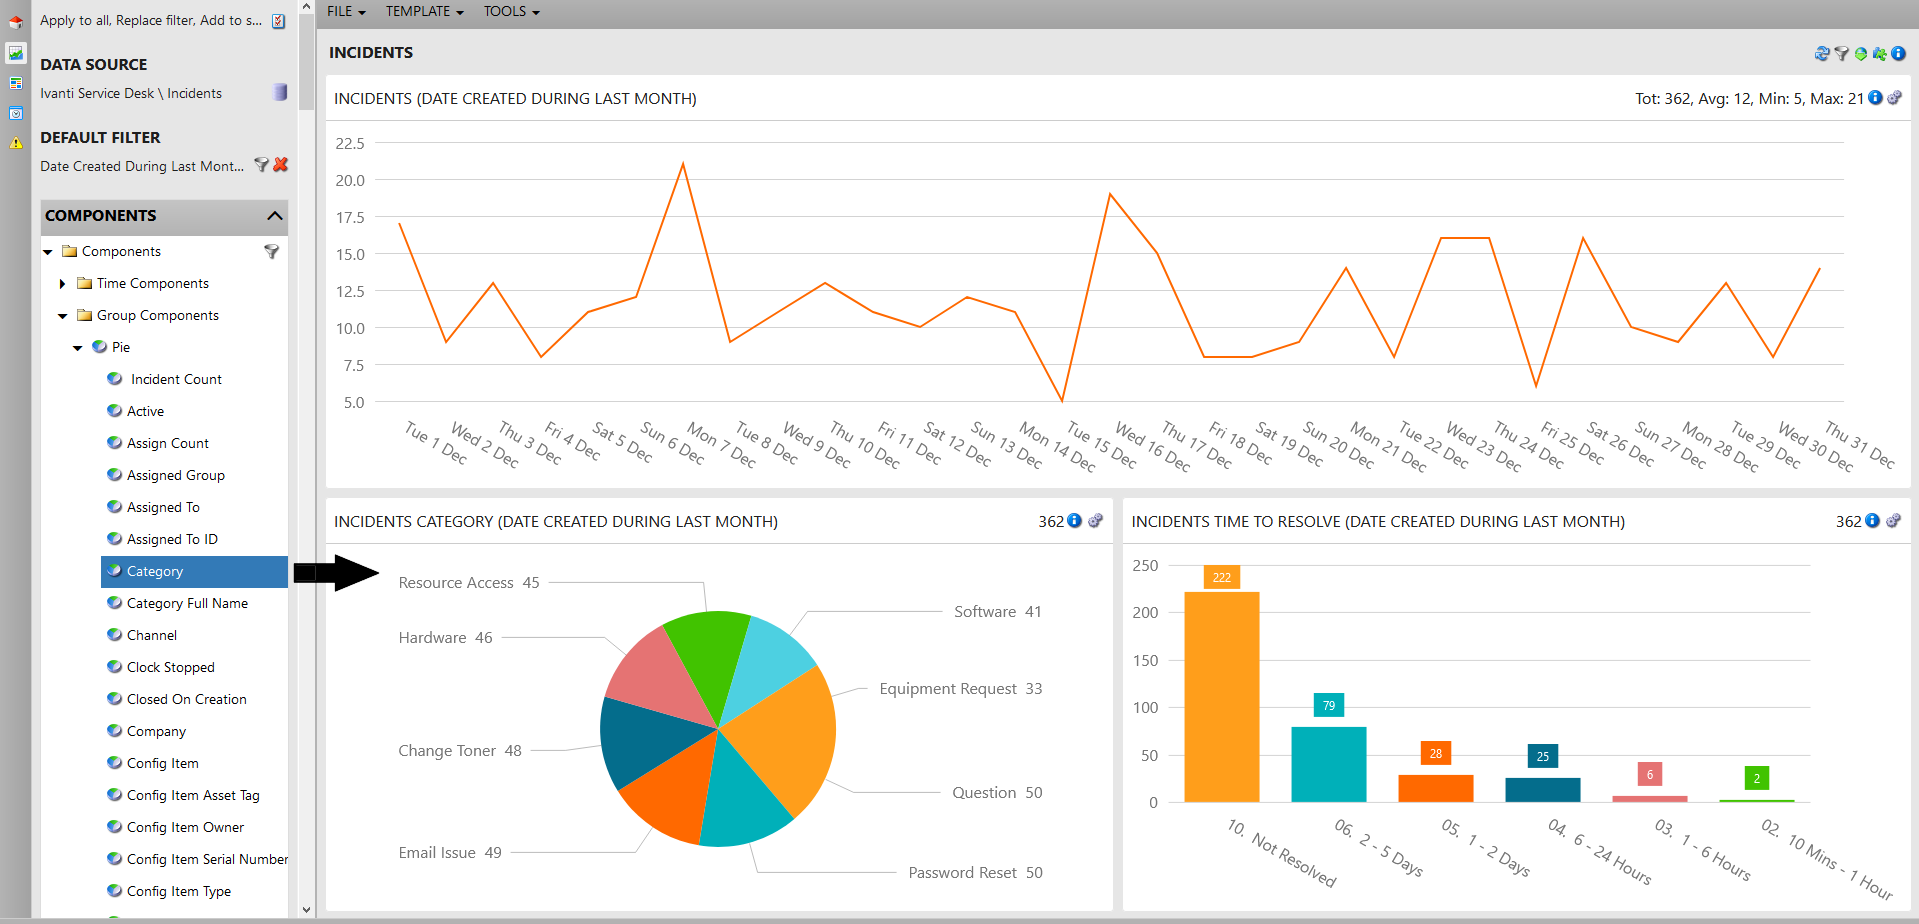
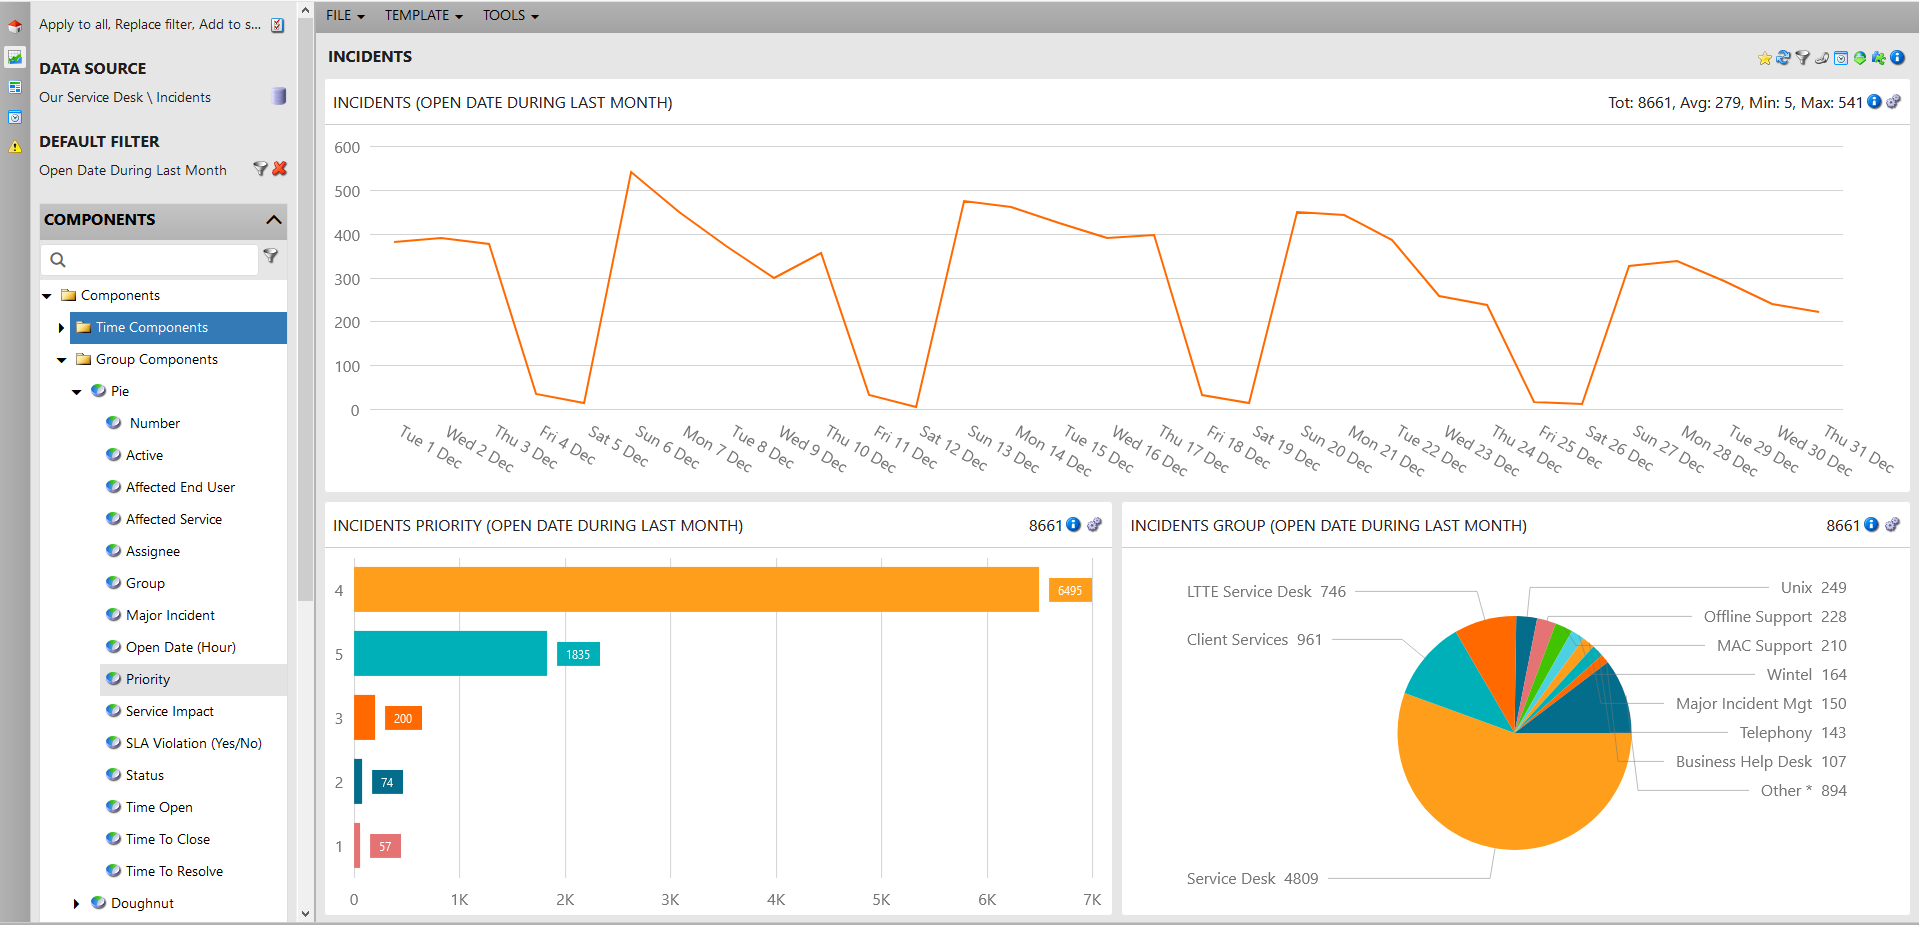
Continuing the service desk example, here are some ways to view a group's assigned incidents for the month:
•To view the number of incidents per day for the group, add a Time component > Line chart to one pane.
•To view incidents by Priority, add a Group component > Pie chart to another pane.
•To view the Time to Resolve an incident, add a Group component > Column chart to the final pane.
•You'll need to know more about components later on. Some components offer the ability to create more than one series or a calculated series for the viewable data. For details, see About components.
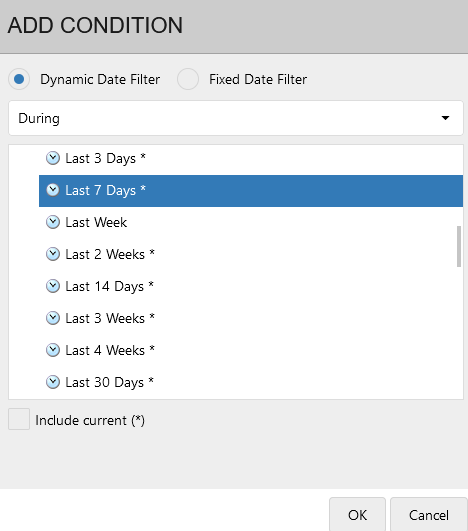
7.To change the date range of the displayed data:
•Click the ![]() icon in the dashboard header and click Update date filters.
icon in the dashboard header and click Update date filters.
•From the Add Condition dialog, you can change the current display using a dynamic date or fixed date filter. For this example, use a dynamic date filter to change the date range to incidents from the Last 7 days, then click OK. The dashboard data will update accordingly.
8.To view data points in greater detail:
•Hover your mouse over one the data points in a pane (for example, a pie chart segment), then click and select View Records. A new page will display, listing the underlying records associated with that particular data. You can drill down even farther by opening an individual record in the list.
•You can also create temporary filters based on a single data point. For details, see "Interactive features" below.
9.You now have a completed dashboard. Click File > Save to save it in a folder, then click OK. To open this dashboard again, click File > Open and navigate the folder structure to locate this dashboard. Click it to open.
Interactive features
When components are displayed in a dashboard, you can view or filter the underlying data in more detail using a several methods.
Perform these actions from the individual component panes that comprise your dashboard:
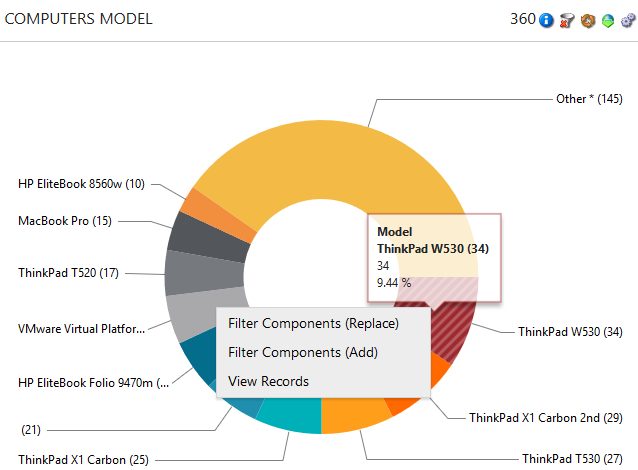
•Click the record count number in a pane header ("360" in the image below) to display the full list of detailed records underlying the component. Not all components have record counts.
•Hover your mouse over individual data points to see more details (such as "ThinkPad W530" in the image below).
•Click a single data point to open a menu where you can:
•Filter Components (Replace): Create a temporary filter condition based on that data point to dynamically filter the rest of the dashboard. For example, if you select this option on "ThinkPad W530" below, a filter condition is applied to each pane in the display to show just the data that relates to ThinkPad W530 devices.
•Filter Components (Add): Filter the dashboard by combining the first temporary filter condition with a second one based on an additional data point.
•View Records: Displays the underlying records contained within a data point. From the display, you can sort columns, export the data (by clicking the ![]() icon), and double-click a record to display it in its native application (if enabled by the administrator). For more details about exporting data, see "Exporting" below.
icon), and double-click a record to display it in its native application (if enabled by the administrator). For more details about exporting data, see "Exporting" below.
To clear all temporary filters and re-establish the base display: In the component pane header, click the ![]() icon. (You may need to click the
icon. (You may need to click the ![]() icon to view the
icon to view the ![]() icon.)
icon.)
Exporting
Dashboards are meant primarily for onscreen viewing, but you can export the content into a variety of formats to share with others.
Depending on the content type, you can export a dashboard to these formats: Word, PDF, HTML, Excel, or PowerPoint.
To schedule periodic exports, see Scheduled exports.
1.In the dashboard header, click the ![]() icon and select Export to export all onscreen content. To export at the individual component level, click the same icon in the component header. (You may need to click the
icon and select Export to export all onscreen content. To export at the individual component level, click the same icon in the component header. (You may need to click the ![]() icon to view the
icon to view the ![]() icon.)
icon.)
2.The Export dashboard dialog displays with these options:
•Format: Select the file format for the export. If exporting to HTML, the file will export to a .ZIP file instead of displaying onscreen.
•Theme: Select the background color to be black or white—this only affects graphics-based content. The white theme helps save on toner when printing.
•Use template: Export to a Word template. (If the content wasn't designed for use with a template, this option is dimmed.)
•Show description: Include a summary of the series, data source, and filter conditions used in the dashboard.
•Show notes: Include any optional notes that are part of this dashboard.
•Show table data: Include data that's presented in tables. As this option can export a lot of data, carefully consider the number of records you'll be exporting.
•Show URL record link: For list components only. Embeds URL links in the exported record list that can open specific records (for example, service desk incidents) in the native application.
3.Click OK to save the item in the Downloads folder defined for your browser. Depending on the type of export, you may be prompted to acknowledge the Save or Open action as displayed by your browser.
You can export dashboards as a screenshot as well. In the dashboard title bar, click the ![]() icon and select Export Screenshot to export all onscreen content. To export at the individual component level, click the same icon in the component header. (You may need to click the
icon and select Export Screenshot to export all onscreen content. To export at the individual component level, click the same icon in the component header. (You may need to click the ![]() icon to view the
icon to view the ![]() icon.)
icon.)
The screenshot will be saved as a .PNG image file in the Downloads folder defined for your browser.
To present a dashboard in a document as it appears onscreen (in a single view rather than across multiple pages), you can export the layout using an Xtraction-generated Word template.
Simple dashboards with fewer panes work best when exporting to a template. Dashboards with many panes aren’t as well suited (the space needed is often insufficient), but in such a case, the template uses placeholders instead of the layout of the dashboard. You can delete the placeholders as needed.
After exporting, the template will display with the same panes of the dashboard layout, along with separate panes for Notes and Descriptions if included. Note that if the Description and Note fields are very long, your exported result may not have the desired look.
Exporting to a template is a three-procedure process—create and edit the template to your liking, upload the template into Xtraction, and finally export the dashboard content to the template.
Before starting, make sure that your dashboard composition is complete and contains all components to be included in the result.
To create and edit a template
1.Click the Template > Create > Dashboard menu.
2.Xtraction creates the template and opens the standard Windows Open/Save dialog.
3.Click Save File, then OK to save the dashboard in the Downloads folder defined for your browser. If you want to edit the template after saving, right-click the DOTX file and select Open to open it. (To ensure that you open the DOTX file and not a DOCX version of the file, don't double-click to open it.)
The template created by Xtraction is simple in layout and has these characteristics:
• Is landscape orientation only.
•Has an initial layout of one page.
•Has placeholders in a table structure, which constitute important links that enable Xtraction to insert components into the template. You're advised to keep the placeholders in the table so they can be located when exporting the dashboard, but you're free to alter the format by:
•Splitting the placeholders into multiple tables on multiple pages.
•Changing the table/row/cell sizes.
•Changing or deleting Xtraction-generated titles (which precede some placeholders).
•Removing any unwanted placeholders or reordering the sequence.
To upload the template into Xtraction
1.Click the Template > Upload Template menu.
2.In the Upload dialog, click Select file. Your browser opens a window enabling you to locate the template in your folders.
3.Double-click the file to upload it. Xtraction acknowledges this process by confirming the upload.
4.Click Close.
5.Click File > Save to save the template with the design.
The Template menu also enables you to download a template, provided that one already exists.
To export the content to the template
With the template prepared, uploaded, and saved, export the dashboard content to the template following the "Exporting a dashboard" procedure above. The exported file will save to the default Downloads folder for your browser.