Log Files
Purpose
Log files contain host-specific logs from all internal system events and messages. For example, if one of the handlers defined in your security configuration becomes active, vWAF creates a log file entry with detailed information. In the case of the Invalid Args Handler, for example, the log file entry tells you whether an argument is invalid because it matched with the blacklist, or because it’s missing on the whitelist. The log file entry even shows you precisely which regular expression of your configuration has matched.
For a detailed list of all log file entries possible, please refer to Entries in Application-Specific Log Files.
There’s a separate log file for each host. However, in the administration interface you only ever see one consolidated view per application. This means that you always see, at the same time, the log file entries for all hosts of an application.
In addition to the log files for each host, vWAF also generates an additional Default Error Log, which logs events that don’t relate to a specific host. In the Audit Log you also see a list of all security-related changes to the system. In addition to this are the normal log files from your web server (only accessible on the system level and can’t be viewed via the vWAF administration interface).
Opening
- Activate the
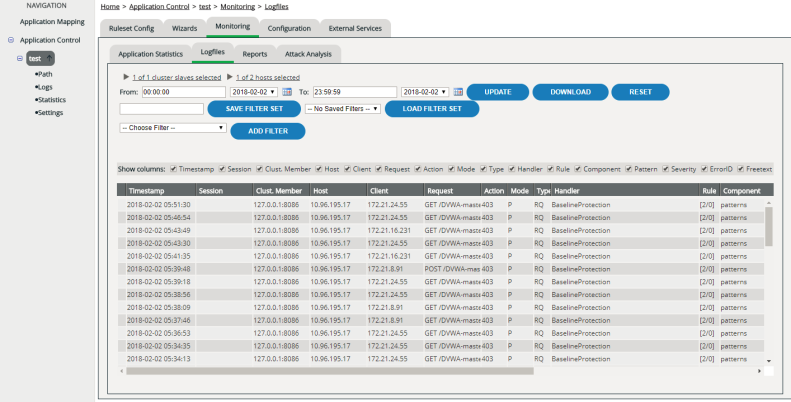
Monitoring | Logfiles tab.
A display of all log files entries for the current day appears.
For hosts with a large number of requests, the log files can become very large and it may therefore take some time before the display updates.
To see the complete text of an entry when the text doesn’t fit into the column, just hover the mouse over the entry. The full text then appears in a floating popup window.
Settings that influence what’s logged
Which data is logged depends on various settings of your configuration:
- Full request logging
If full request logging has been activated in both Global Configuration and in the settings for a specific application at the same time (see Editing Applications), vWAF logs the full request header and the full request body of all denied requests.
- Reduced logging
By default, vWAF used Reduced Logging for all hosts, but you can select the logging level for any host (see Editing Applications). If reduced logging is active for a host, vWAF doesn’t create a log file entry for each request on this host, but only if one of the configured handlers has been active. This can be useful for pages with high traffic. To log all requests, disable reduced logging.
- Reduced argument logging
Usually, vWAF fully logs all URL parameters. If “Reduced Argument Logging” was enabled in the Application Control, however, no URL parameters appear in the log files. For example, in this case GET /test/index.php?password=test&user=user is just logged as GET /test/index.php (see Editing Applications).
- Disabled logging for individual handlers
If you’ve disabled logging for individual handlers, events triggered by these handlers don’t appear in the log files (see attribute “enable-logging” of individual handlers).
- Additional logging of headers and arguments
Usually, vWAF logs only parts of a request. With the help of the Log Configuration Handler however, you can also include headers and arguments in the logging process as well if specific character strings occur in a header or in an argument.
- Risk evaluation
If you’ve activated the Classify Request Handler, vWAF provides an evaluation of the risk potential for each request in the log file.
Selecting the time range
You can select the period for which you want to display the entries in the log files:
- Click the
Update button.
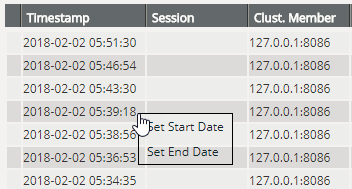
When you click an entry in the table in the Timestamp column, you can easily restrict the time period further by transferring the time displayed as the start time or the end time
Filtering the display
For a better overview or to find specific entries, you can restrict the display specifically to entries matching particular criteria:
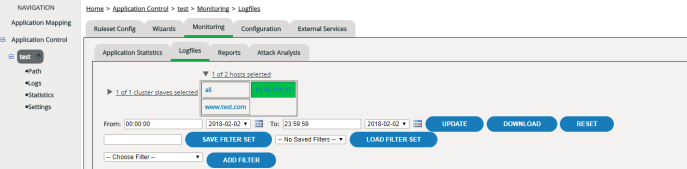
- Select or de-select the desired slaves / hosts by clicking them one after the other. Selected entries are displayed with an orange background color.
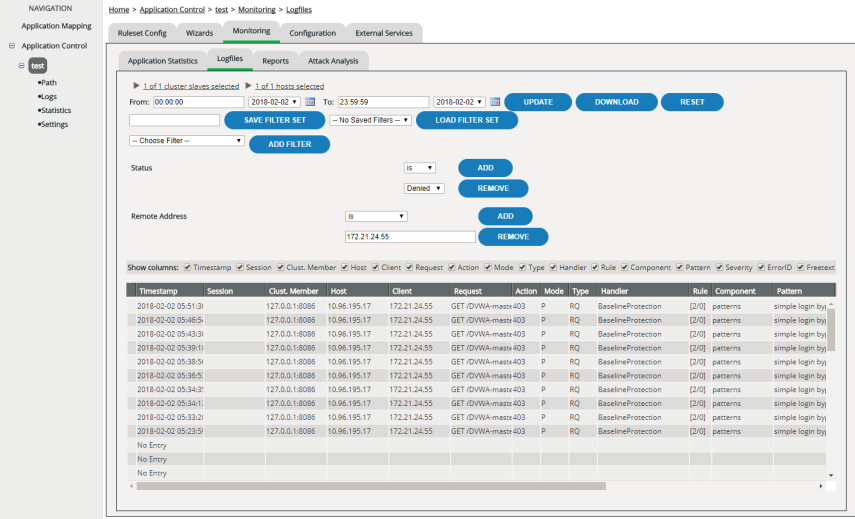
You can add as many additional filters as you want:
- For different filter types, an AND operator always applies, i.e. the log file entries to be displayed must match all these filter criteria (e.g. belong to a specific host and be triggered by a specific handler).
- For multiple filters of the same type, an OR operator always applies, i.e. the log file entries to be displayed must match at least one of these filter criteria (e.g. triggered by handler A or by handler B).
To delete a single filter, click the Remove button after the filter. To remove all filters as well as to reset date, cluster and host selection, click the Reset button next to the date selection fields.
If you click an entry in one of the columns Session or Client, you can easily add an additional filter for precisely that session ID or IP address, without having to enter the individual values manually. If you click an entry in one of the columns Cluster Member, Host, Action, Mode or Handler, this entry is automatically selected in the selection table of the filter settings. To apply the new filter, don’t forget to click the Update button.
Saving and restoring your filter settings
You can save your individual filter settings and later restore them. This is particularly helpful when you use complex filters or want to switch between various filter sets.
To save your filter settings, enter a filter name into the input field next to the Save Filter Set button and then click this button.
To load a filter set, select the name from the selection list and then click Load Filter Set.
You can only load filter sets that you’ve created yourself. You can’t load filter sets that were saved by other users. If you want to delete a filter set, select the menu item My Profile. This takes you to the user management of your own user account. In the section Manage Log Filters you can delete any filter set (see User Management).
Customizing the table
If a column is empty, or if you don’t need the information shown in a particular column, you can hide these columns by disabling the corresponding check boxes above the table.
Also you can change the width of each column by dragging the separator lines in the header of the table to the left or to the right.
Your settings are saved automatically.
Data Displayed
| Column | Meaning |
|---|---|
|
(first column without any heading) |
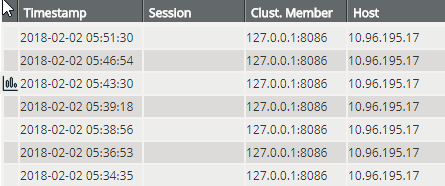
If additional log data is available, a small icon appears here. This is the case for denied requests if full request logging has been enabled in both Global Configuration and for the application in Application Control on the Application Settings tab. Clicking the icon opens a page that shows the full request details and also provides a link to download the log entry plus the headers and the body raw data. |
|
Timestamp |
Date (YYYY-MM-DD) and time at which the entry was made. By default the latest entry is at the top of the list. |
|
Session |
Session ID. This entry is empty in many cases if the Session Handler isn't configured. |
|
Cluster Member |
Cluster member to which the entry relates to. |
|
Host |
Name of the host on which the request was placed. |
|
Client |
IP address of the querying client. |
|
Request |
The request as it was sent. If the option "Reduced Argument Logging" was enabled for the application, URL parameters aren't displayed. |
|
Action |
Indicates what vWAF did:
If reduced logging is activated, accepted requests aren't logged.)
|
|
Mode |
Indicates the mode of the ruleset that was active:
|
|
Type |
Indicates whether the entry relates to a request to a response:
|
|
Handler |
Shows the name of the handler that triggered the log file entry. You may see the names of some handlers that you haven't configured manually. These are fixed, preconfigured, internal system handlers (see also Handlers , and within the Handler topic Internal System Handlers). If no handler name is given, it was a valid request or response and vWAF didn't intervene in any way. If you don't want entries for valid requests and responses to be included in the log files, you can activate reduced logging for individual hosts (see Editing Applications ). |
|
Component |
Shows which attribute or setting of the handler caused vWAF to act. |
|
Pattern |
If any patterns were specified for the handler that triggered the log file entry, the particular pattern that matched is shown here (for details see reference of the particular handler). |
|
Severity |
Assessment of the risk level that's involved with the incident. For details on severity, see Severity of Events Triggered by Handlers . |
|
ErrorID |
Unique error ID to be used in combination with a custom error page (see Setting Up a Custom Error Page ). If you display the ErrorID on your error page, you can ask users to tell you this ID when they get an error message-for example, when one of the protective rules that you've set up is too restrictive. Then you can filter the log view display for the given ID and thus see precisely which handler has denied the corresponding request. |
|
Freetext |
Additional, handler-specific information (see Entries in Application-Specific Log Files). If you've specified some individual additional text in the attribute usertext of the handler, this text is also printed here. |
Going to the triggering event
When a log file entry has been triggered by one of the vWAF handlers, you can go directly to edit the relevant handler to analyze the security configuration and modify it if required.
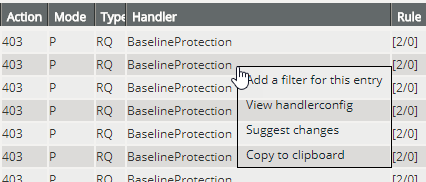
Getting suggestions for improvement
vWAF provides a powerful feature that tells you why a certain request was denied and how you can modify your configuration to avoid this in the future.
- Click the log file entry in the
Action column.
A context menu opens
.
Downloading log data
By clicking the Download button you can save the contents of the current view to a file in CSV format.
All columns are saved, no matter which columns are currently hidden.
Opening the details page and downloading request data
If additional log data is available, a small icon appears in the first column of the table. This is the case for denied requests if full request logging has been enabled in both Global Configuration and for the application in Application Control.
Clicking the icon opens a page that provides the full request details.
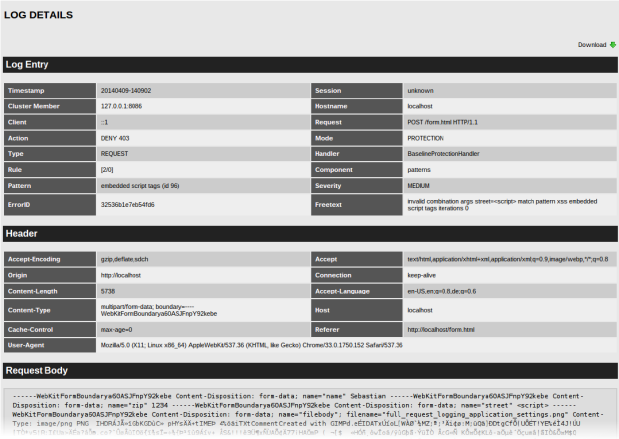
The details page shows:
- the information of all columns (both visible and hidden) of the standard log file view
- all HTTP headers sent by the client
-
if the request was a HTTP POST request: the raw request body (note that only HTTP POST requests contain a body)
The request body might be truncated to the maximum body size configured in Global Configuration.
On top of the details page there is a link labeled Download. When you click this link, you can save the logged request to a file for storage or for further analysis. The format of this file is:
log line header log line values empty line first HTTP header second HTTP header ... empty line raw body data (possibly truncated to the maximum body size as configured in Global Configuration)