Using the Troubleshooting Tools
Introduction
The Troubleshooting page enables you to investigate issues that might be affecting your Gateway or preventing it from operating normally.
This page is intended to enable Ivanti Technical Support teams to help resolve problems with your Gateway infrastructure. Due to the potential for system performance to be impacted through the use of these features, Ivanti recommends you only use this page when advised to do so.
The following tools are available through the Gateways > Troubleshooting page:
Debug logs - Work with Ivanti Technical Support teams to diagnose system issues.
Network troubleshooting commands - Use standard network commands, such as ping, traceroute, NSlookup, and other commands to diagnose networking issues.
System snapshots - Work with Ivanti Technical Support teams to reproduce and diagnose system issues.
tcpdump - Sniff packet headers to diagnose networking issues.
To access Troubleshooting page:
Log in to the Ivanti Neurons for Secure Access portal as a Tenant Admin. See Logging in to Ivanti Neurons for Secure Access.
Use the Gateway Switcher and select Ivanti Connect Secure.
From the Ivanti Connect Secure menu, click the Gateways icon, then select Gateways > Gateways List.
The All Gateways page is displayed showing a list of standalone ICS Gateways and cluster nodes.
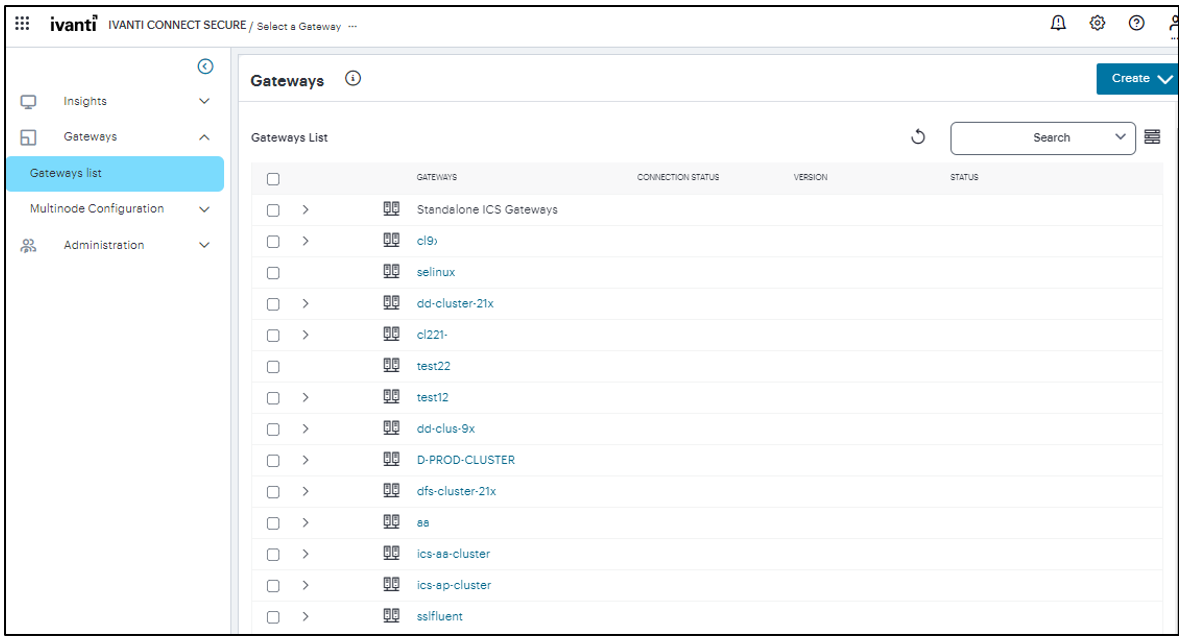
FIGURE 454 Gateways list
In the All Gateways page, double-click the required Gateway from the list.
From the Ivanti Connect Secure menu, click the Gateways icon, then select Gateways > Troubleshooting.
The Troubleshooting Overview page appears.
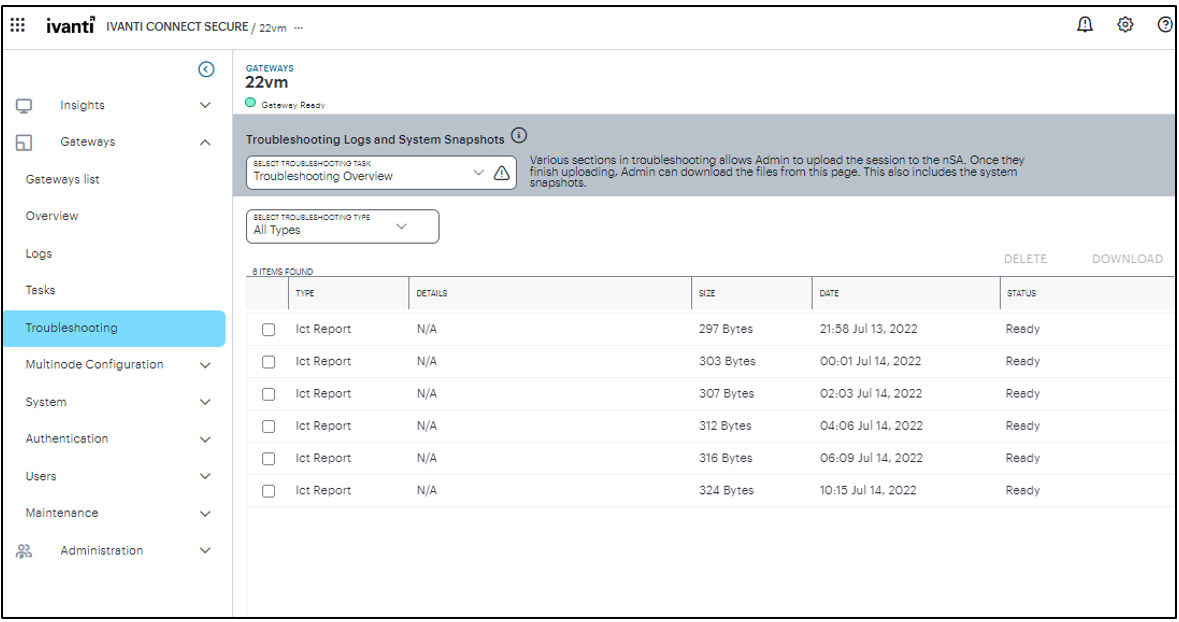
FIGURE 455 Troubleshooting Overview page
Using the Debug Log
The Ivanti Technical Support teams might direct you to create a debug log to assist them in helping you debug an issue with the system.
To use debug logging:
From the Troubleshooting Logs and System Snapshots drop-down menu, select Debug Log.
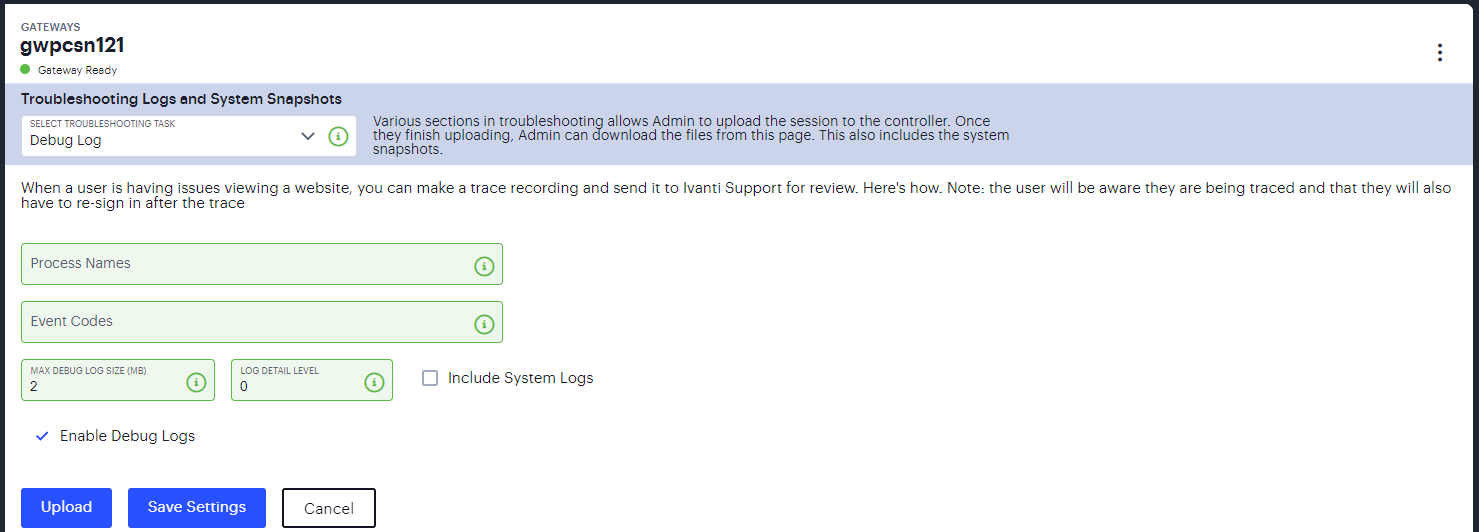
FIGURE 456 Debug Log Configuration page
Specify the Process Name.
Specify the Event Code.
Specify a Maximum debug log file size. The default is 2 MB. The maximum is 250 MB.
Specify the debug Log detail level.
Select Include System Logs* option to include system logs in the debug log file. Recommended.
Select Enable Debug Logs.
Click Save Settings. The system begins generating debug log entries.
Click Upload.
A confirmation message is displayed. You can then download the file from the Troubleshooting Overview page and analyze the logs.
Using Network Troubleshooting Commands
You can run common network troubleshooting commands such as arp, ping, ping6, traceroute, traceroute6, NSlookup, and AvgRTTs from the admin console. You can use these connectivity tools to see the network path from the system to a specified server. If a client can ping or traceroute to the access system, and the access system can ping the target server, any remote users should be able to access the server through the access system.
To run network troubleshooting commands:
From the Troubleshooting Logs and System Snapshots drop-down menu, select Commands.
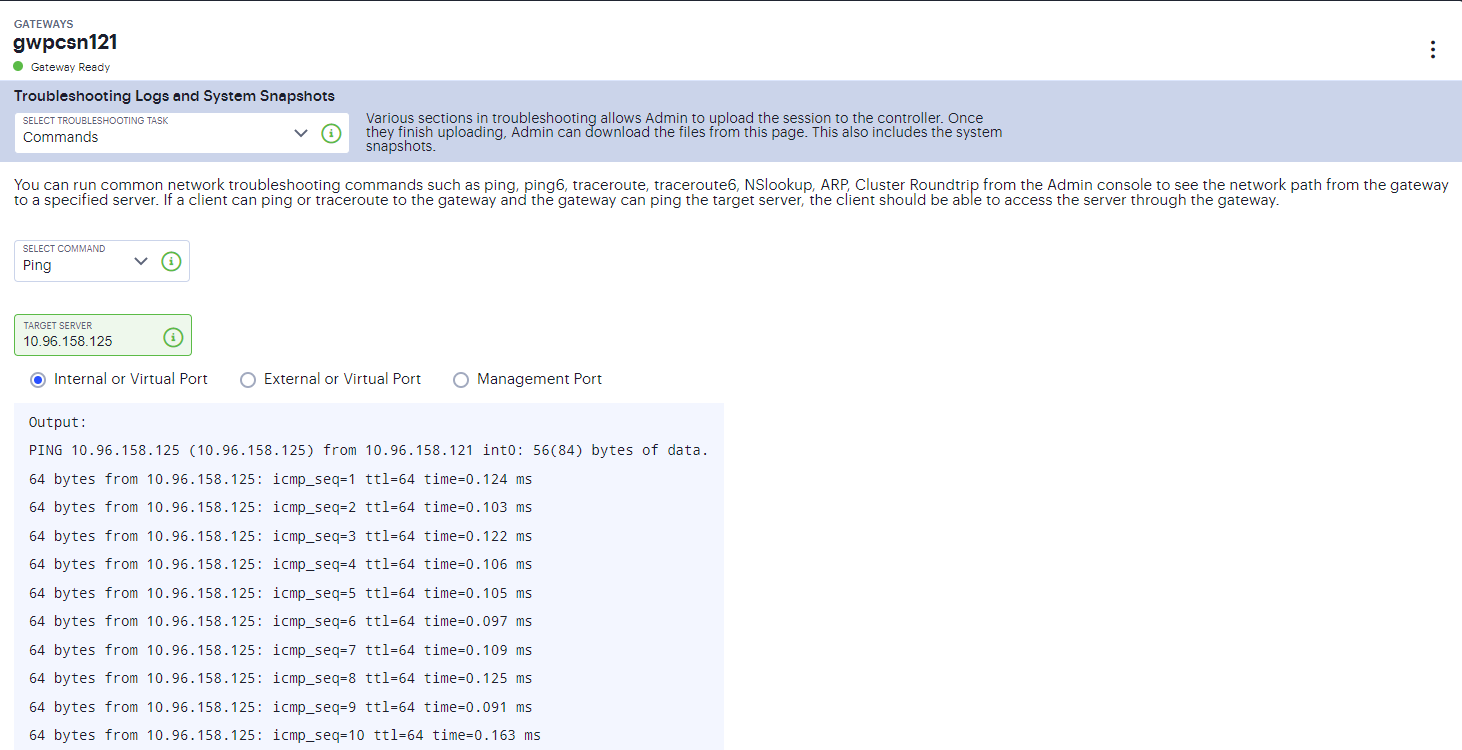
FIGURE 457 Network Troubleshooting Commands page
Select a network troubleshooting command from the options:
Ping/Ping6
Traceroute/Traceroute6
NSLookup
ARP
AvgRTTs
Portprobe
Cluster Roundtrip
When prompted:
Specify the IP address or hostname for the target server.
Select the interface from which to send the command.
Click Start to run the command and write the output to the screen.
Using System Snapshots
A snapshot of the system state captures details that can help Ivanti Technical Support teams diagnose system performance problems. The system stores up to ten snapshots, which are packaged into an encrypted “dump” file that you can download and then e-mail to Ivanti Technical Support teams.
To create and manage system snapshots:
From the Troubleshooting Logs and System Snapshots drop-down menu, select System Snapshots.
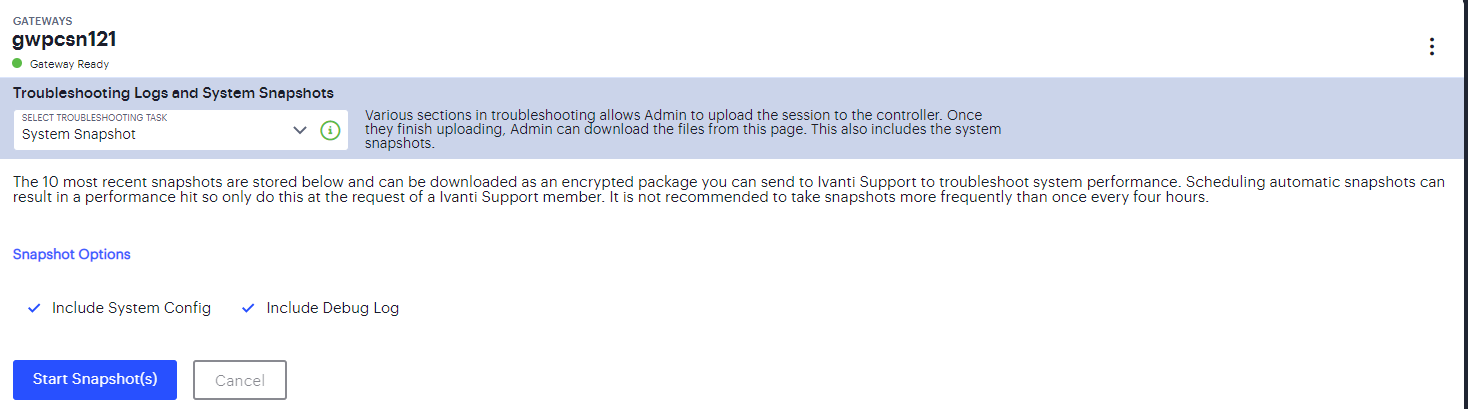
FIGURE 458 System Snapshots Configuration page
Select Include system config to include the system configuration file in the snapshot.
Select Include debug log to include debug logs (if any).
Click Start Snapshot(s).
A confirmation message is displayed. You can then download the file from the Troubleshooting Overview page and analyze the logs.
Using the TCP Dump Utility
To use TCP Dump utility:
From the Troubleshooting Logs and System Snapshots drop-down menu, select TCP Dump.
Configure the following:
Select the ports on which to sniff (Internal, External, Management).
Specify a Filter expression.
Select a promiscuous mode option.
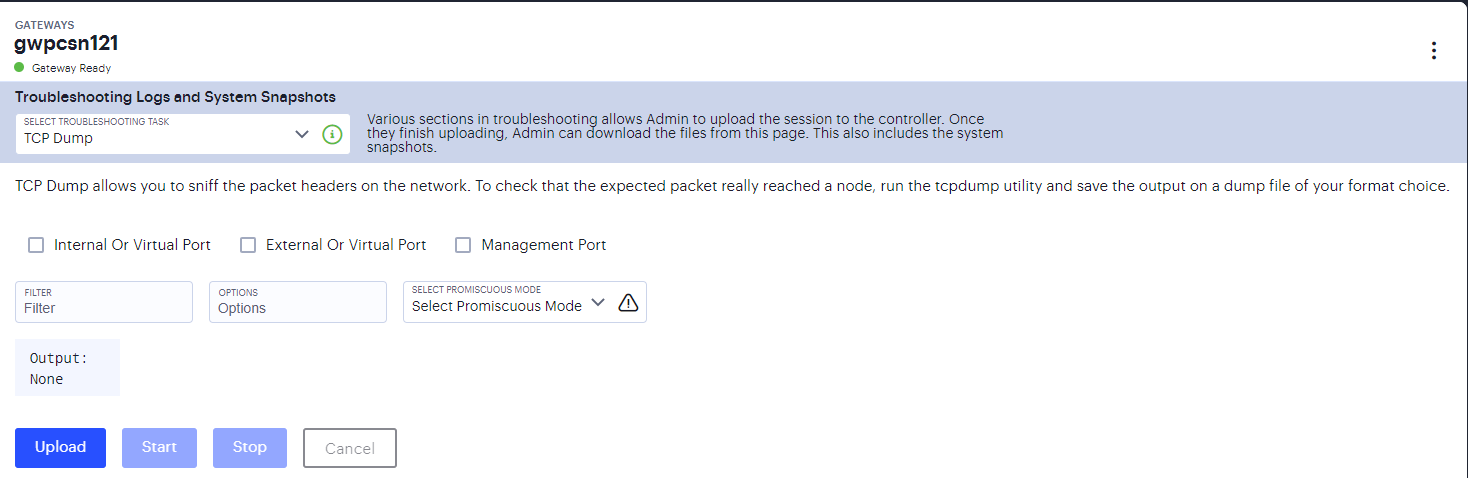
FIGURE 459 TCP Dump Configuration page
Click Start to start the TCP Dump process.
Click Stop to write the TCP Dump output to the screen.
Click Upload.
A confirmation message is displayed. You can then download the file from the Troubleshooting Overview page and analyze the logs.