Ivanti Connect Secure Gateway Analytics
Introduction
Ivanti Neurons for Secure Access Admin portal provides visibility of user activity and service usage across your Ivanti Connect Secure Gateways in your enterprise through network activity analytics, gateway performance graphs, application usage metrics, and stored activity logs.
After you log in to the Ivanti Neurons for Secure Access Admin portal and select Ivanti Connect Secure from the Gateway Switcher (Ivanti Connect Secure, Ivanti Neurons for Secure Access), Ivanti Connect Secure displays the Network Overview page. This page presents a top-down overview of your application infrastructure, providing an opportunity to monitor user and Gateway activity, and to identify problems and compliance issues as they occur. For more information, see Reviewing Your Network Activity.
Through the Ivanti Connect Secure menu, use the Insights menu icon to:
View graphs, metrics, and logs concerning all users activities, see Reviewing Users Activity.
View graphs, metrics, and logs concerning to individual user activities, see Reviewing Individual User Activity.
See details and usage of applications configured in your Ivanti Connect Secure service, see Reviewing Application Usage.
View graphs, metrics, and logs concerning to all gateways status and versions, see Reviewing Gateways Status and Versions.
Configure certain actions based on different types of Insights, see Configuring Actionable Insights.
Note
Ivanti Connect Secure provides both a light theme and a dark theme for the UI display.
Reviewing Your Network Activity
The Network Overview page shows real-time analytics data for your application infrastructure, providing a one-page dashboard of activity across your organization.
To access the Network Overview page:
Log in to the Ivanti Neurons for Secure Access Admin portal as a Tenant Admin, and select Ivanti Connect Secure from the Gateway Switcher. See Logging in to Ivanti Neurons for Secure Access.
The Network Overview page appears by default.
To return to the Network Overview page at any time, click the Insights menu icon and then click Overview. Alternatively, click the “Ivanti Neurons for Secure Access” banner at the top.
Ivanti Connect Secure provides bread-crumb navigation for all Insights pages at the top.
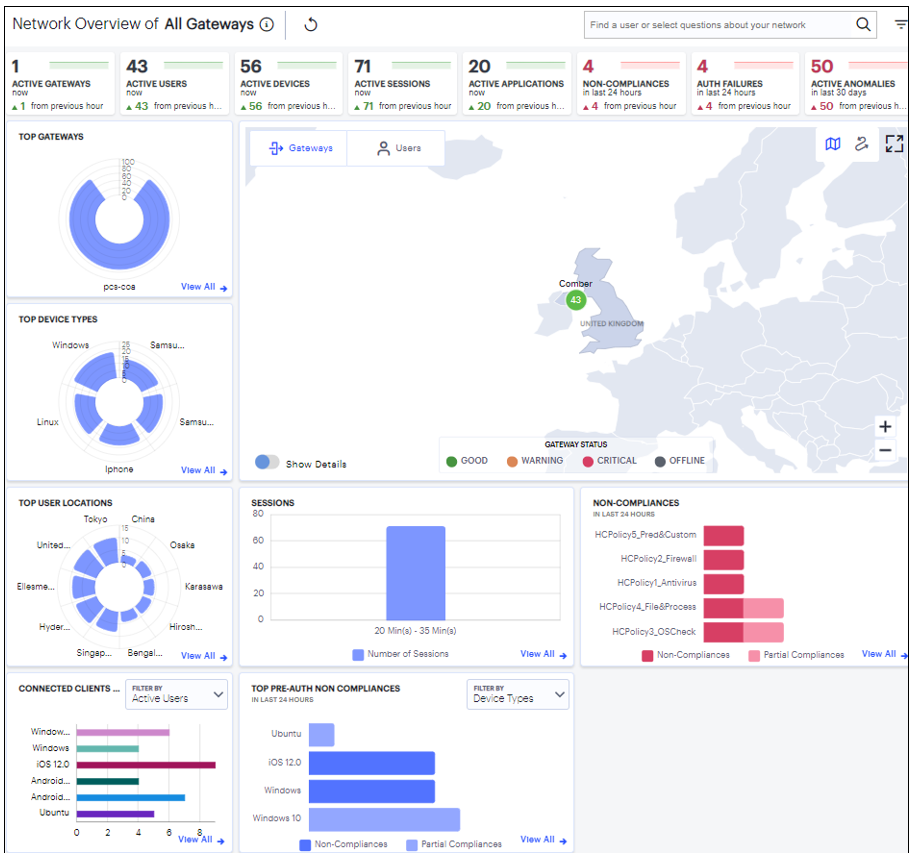
FIGURE 23 An overview of Network activity across your enterprise
Understanding the Display
The primary components of the Network Overview page are the following:
Filter bar, allowing the selection of any individual Ivanti Connect Secure Gateway. For details, see Using the Filter Bar.
Summary ribbon, showing totals for active Gateways, Users, Devices, Sessions, Applications, Non-Compliances, Auth Failures, and Anomalies. For more details, see Viewing the Network Summary Ribbon.
Switchable World Map and Sankey chart, showing active Gateways locations and Users locations:
In the world map view, each Gateway location and User location provides a summary of the activity observed there. For more details, see Using the World Map.
In the Sankey chart view, you can view the relationships between user groups, device types, and Gateways. For more details, see Using the Sankey Chart View.
Radar charts, providing top usage data for Gateways, Device Types, and User Locations. For more details, see Using the Top Active Breakdown Charts.
Bar chart breakdowns showing Sessions, Non-compliances, Connected Clients Version and Pre-auth Non-Compliances activity. For more details, see Using the Sessions, Non-Compliances, Connected Clients Version and Pre-Auth Non-Compliances Charts.
Note
The data in this page refreshes automatically every 5 minutes.
With each chart, click the View all link to view detailed log records for that category.
The following principles apply to all elements of the page:
A user can have one or more devices.
Each device can have one or more active secure access sessions on multiple gateways.
One session can connect to multiple applications.
One session can be associated with multiple Gateways.
One Gateway can have multiple applications registered with it.
Using the Filter Bar
Ivanti Connect Secure uses the top part of the display on all Insights data analysis pages to show the current page title, the default time period, and options to:
Manually refresh the data
Set a filter for a specific Ivanti Connect Secure gateway
Ask a predefined question (Intent):
Search for a specific user in the tenant by typing the username
Show me users connected in last one hour
Show me non-compliant users
Show me users connected more than one days
Show me users from most busy gateway
Show me users from least busy gateway
By default, analytics data on this page and others is shown for the last hour or current day. To manually refresh the data, click the circular arrow:
FIGURE 24 Refreshing the data
Ivanti Connect Secure provides the ability to show focused metrics for a specific Ivanti Connect Secure Gateway. To select a specific gateway, use the filter icon:
FIGURE 25 The Filter icon
In the Filter panel, from the drop-down list select the required gateway and click Apply. To clear the selection, click Clear All.
Viewing the Network Summary Ribbon
The Summary ribbon at the top of the page shows data totals for the selected time filter:

FIGURE 26 Viewing the Summary Ribbon
The ribbon indicates the totals accrued for each category during the displayed time period, as indicated adjacent to the category name.
The following categories are provided in the ribbon:
The number of Active Gateways.
The number of Active Users.
The number of Active Devices.
The number of Active Sessions.
The number of Active Applications.
The number of Non-compliances. In other words, non-compliant attempts to access your applications. For the default time period filter, non-compliance totals shown here are for 24 hours. For other selected time periods, the number reflect the total for that period.
For the default time period filter, Auth Failures totals shown here are for 24 hours. For other selected time periods, the number reflect the total for that period.
The number of Anomalies detected by Ivanti Connect Secure. That is, the total number of geographic anomalies. For the default time period filter, anomaly totals shown here are for the previous 30 days, and include only unacknowledged anomalies. For other selected time periods, this total includes both acknowledged and unacknowledged anomalies.
If you are currently viewing data for the last hour, each category in the ribbon includes a trend graph (highlighted, top) showing the changes in data during the hour. Also included is a change value (highlighted, bottom) based on the previous hour:
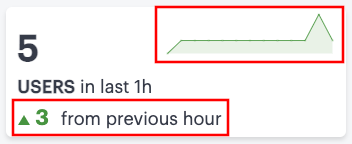
FIGURE 27 Data trends for this hour versus the previous hour
Note
In the default last hour view, while data for Active Gateways, Users, Devices, Sessions and Applications is shown as such, Non-Compliances and Auth Failures are shown for the previous 24 hours, and anomalies are shown for the previous 30 days. This is as indicated against the Category name.
Additional trend indicators are present for the last hour time period only. Trends are not applicable when any filter is applied (intent or gateway).
If you click on any of the categories in the ribbon, Ivanti Connect Secure displays a sliding info-panel dialog showing more details for that category. For example, if you click on the Active Gateways category, a panel appears showing the list of active Gateways. In this case, a summary box is displayed for each Gateway showing statistics relevant to that instance, such as the number of active users, active sessions, active devices, non-compliance events, system status such as the system uptime, last config update, session counts such as current SSL sessions count, auth-only sessions, ActiveSync device count.
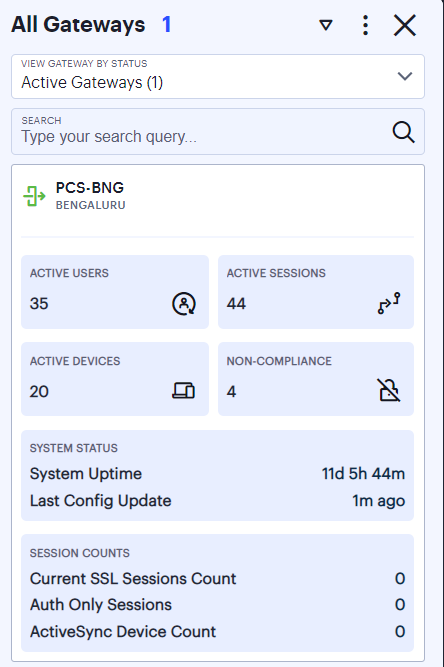
FIGURE 28 Viewing the Gateways info-panel
Note
This version of the info-panel shows details for all Gateway locations. To view an info-panel for a single Gateway location, click the Gateway location bubble in the world map. For more details, see Using the World Map.
For the Active Gateways info-panel, use the View Gateway by Status drop-down list to change the type of Gateways displayed in the panel. Choose from:
All Gateways: All Gateways regardless of status.
Active Gateways: All active Gateways. That is, only Gateways that have active sessions. This is the default view.
Offline Gateways: All offline or unregistered Gateways. That is, only Gateways that are unresponsive or not yet registered with the Ivanti Neurons for Secure Access.
Online Gateways: All online Gateways. That is, all Gateways that are registered with the Ivanti Neurons for Secure Access.
Note
The number of instances of each type is given in brackets.
For example, by selecting Offline Gateways, the panel updates as follows:
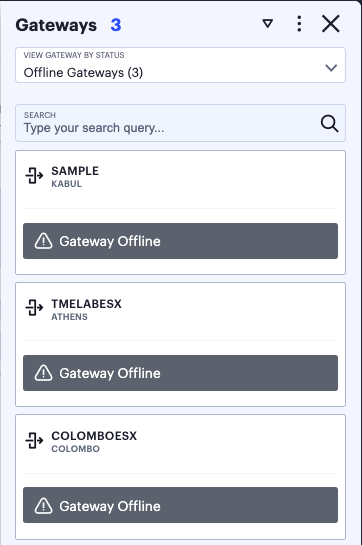
FIGURE 29 Viewing all offline/unregistered Gateways in the Gateways info-panel
Use the Search bar at the top to filter the results list. For example, to show only those Gateways that match a search string. To clear your search, click CLEAR SEARCH RESULTS.
To learn more about the meaning of the different indicator colors used in the info-panel, see Understanding Gateway Status Indicator Colors. Hover your pointer over the instance health indicators to display a tooltip showing more specific details and values.
Click on any Critical or Warning notification banner to display a drop-down summary of the issues:
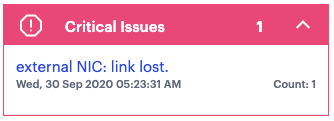
FIGURE 30 Viewing critical issues
You can click on each entry to obtain more details and logs concerning the issue.
Note
For the Active Users info-panel, Ivanti Connect Secure displays an average UEBA threat score. To learn more about UEBA threat scores, see Reviewing Users Activity.
Note
For Non-Compliance and Anomalies info-panels, summaries are displayed on a per-user basis, with the reason for the event shown.
To change the sort order of the items displayed in the info-panel, use the Sorting controls at the top:

FIGURE 31 Changing the info-panel sort order
Use the dots icon to select the sort criteria, then use the arrow icon to toggle between ascending and descending order. The sort criteria varies depending on the category chosen, and is based on the statistics shown for each item. For example, by selecting the Gateways info-panel, you can choose the display order for your Gateways based on the following statistics:
Active Users
Non-Compliances
Active Devices
Number of Issues
Gateway Name
City Name
A tick identifies the currently chosen criteria.
For Anomalies, the info-panel lists Unacknowledged and Acknowledged anomalies, and provides additional functionality to enable you to Acknowledge individual Unacknowledged anomalies.
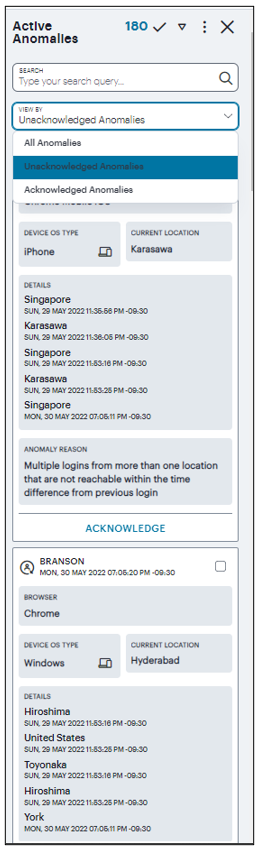
FIGURE 32 Viewing the Anomalies info panel
Each box in the info-panel lists a user and the active anomalies connected to them. For each user, from the Unacknowledged anomalies list, click ACKNOWLEDGE to remove this anomaly from the list.
Alternatively, use the tick icon and check boxes adjacent to each user name to acknowledge multiple, or all, anomalies in a single action. Note that when the default “active” time period filter is selected, the anomalies count in the Summary ribbon decreases by 1 for each acknowledgment.
For the Gateways info-panel, click a Gateway name to access the corresponding Gateways Overview page that provide usage metrics or configuration details for that item.
Using the World Map
The Map view contains Gateways and Users tabs. Your Gateways locations are presented on the map as a series of geographically-placed counters, with each counter depicting a location, the status of the services held there, and the number of Gateways. To learn more about the colors used to indicate service status, see Understanding Gateway Status Indicator Colors.
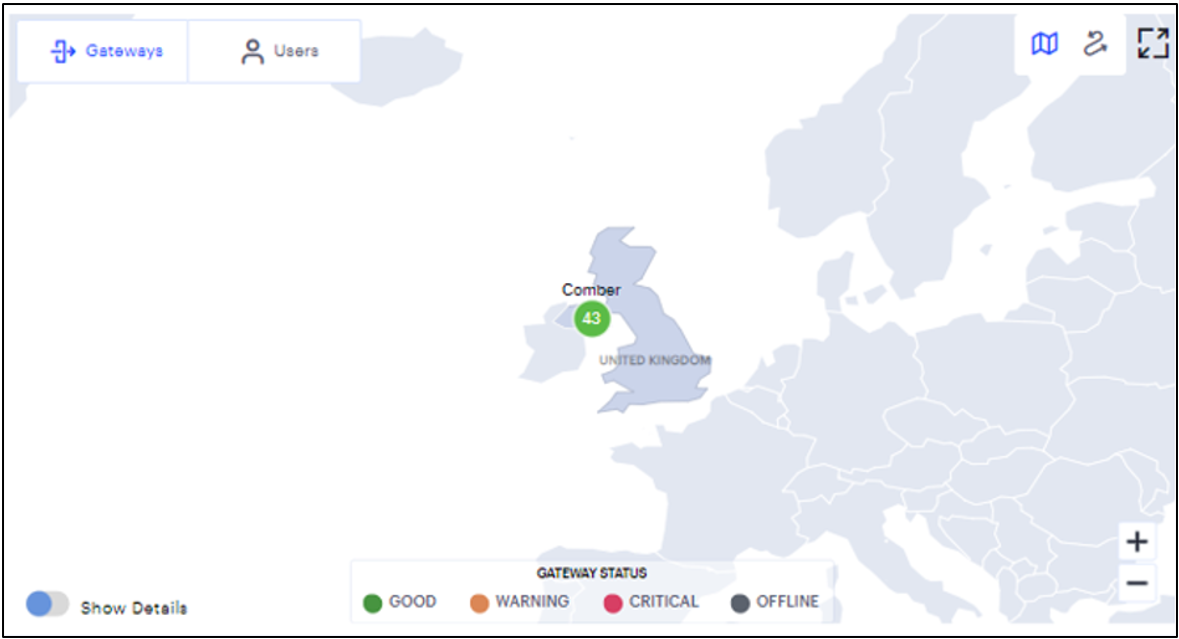
FIGURE 33 Viewing the world map - Gateways
Use the Plus (+) and Minus (-) controls to zoom in and out of the world map, allowing you to select the desired level of detail. Alternatively, use your pointer to manipulate the map display. Double-click/tap an open area of the map to zoom in, or reposition the map display through drag and drop.
To toggle between the Map view and Sankey chart view, use the icons at the top-right:
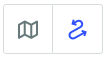
FIGURE 34 Toggle between Map view and Sankey chart view
The data shown is representative of the currently-selected time period, and by default shows active data (for the previous 1 hour). To learn more about setting time periods for the displayed data, see Using the Filter Bar.
To learn more about network usage or alerts at a particular location, hover your pointer over the location identifier. It shows the active user sessions established from that Gateway location to other Gateway locations.
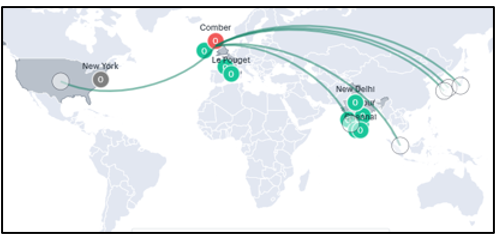
FIGURE 35 Sessions from the Gateway location
By turning on the Show Details switch located at the bottom-left of the map, and by hovering on a Gateway location, the current Gateway status is indicated by the color scheme shown in the legend.
Note
To learn more about the meaning of the different indicator colors used in the map and panels, see Understanding Gateway Status Indicator Colors.
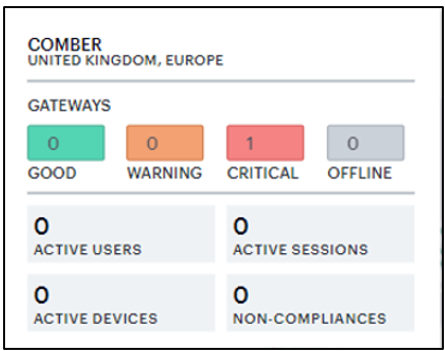
FIGURE 36 Viewing an extended location status
To expand the current view, click the Full Screen icon:

FIGURE 37 Expand the current view
In the expanded view, the Gateway Status pop-up summary panel is expanded to include more details concerning usage at that location:
In addition to the status indicator, this version of the summary panel shows the following statistics:
Active Users: The number of unique users that have sessions through Gateways at the location (as also indicated in the location bubble)
Active Sessions: The number of sessions accessed through Gateways at the location
Active Devices: The number of unique devices that have sessions through Gateways at the location
Non-Compliances: The number of active non-compliant sessions (full/partial non-compliant) in this location
Note
Click the Full Screen icon again to return to the standard view.
In both views, click a location bubble to display a sliding info-panel dialog for the Gateways at that location.
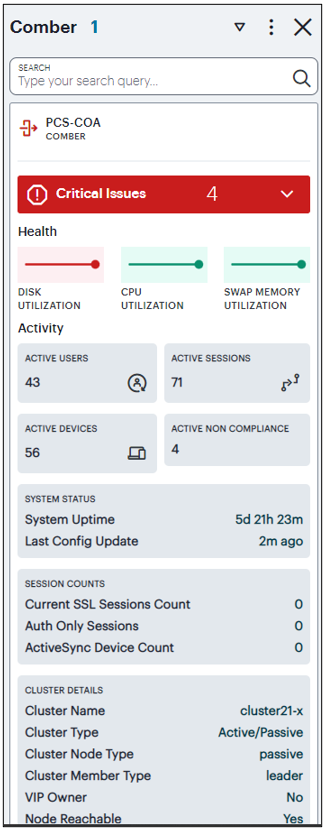
FIGURE 38 Viewing the Gateway info-panel for a single location
Use this info-panel to view health and usage statistics for the location, with further details concerning any reported problems with the deployed Gateways. The panel displays the following details:
Location name and number of Gateways: The descriptor for this location and the number of Gateway instances deployed there.
Active Users: The number of unique users that have sessions through Gateways at the location (as also indicated in the location bubble).
Active Sessions: The number of sessions accessed through Gateways at the location.
Active Devices: The number of unique that have sessions through Gateways at the location.
Non-Compliance: The number of active non-compliant sessions (full/partial non-compliant) in this location.
System Status: The system uptime and the time since the last config update.
Session Counts: The number of current SSL sessions, number of auth only sessions, and the number of ActiveSync devices.
Cluster Details: The cluster name, type, and node details.
This view of the info-panel displays data for a single Gateway location. To view an info-panel showing data for all Gateway locations, click the Gateways category in the Summary ribbon. To learn more, see Viewing the Network Summary Ribbon.
Note
When displaying active data, all non-compliance and unacknowledged anomaly totals are displayed for the previous 24 hours.
To learn more about the information and controls contained in the info-panel, see Viewing the Network Summary Ribbon.
Understanding Gateway Status Indicator Colors
In the world map view, your current Gateway status is indicated by the color scheme shown in the legend:
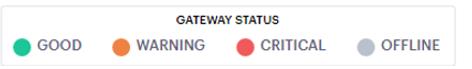
FIGURE 39 Map legend showing Gateway status meanings
Good (Green): All Gateways are functioning normally.
Warning (Amber): One or more of the Gateways at that location is experiencing a warning scenario. This status is triggered by the occurrence of any one of the following conditions:
Gateway device CPU usage is within the range 80% - 90%
Gateway device swap memory usage is within 10% - 50%
Gateway device disk usage is within the range 80% - 90%
Critical (Red): One or more of the Gateways at that location is experiencing an critical alert scenario. This status is triggered by the occurrence of any one of the following conditions:
Gateway device swap memory usage is greater than 50%
Gateway device disk usage is greater than 90%
At least 1 critical error has been reported
Offline (Grey): All offline or unregistered Gateways. That is, only Gateways that are unresponsive or not yet registered with the Ivanti Neurons for Secure Access.
Furthermore, counters in the Summary ribbon use the following color scheme to reflect status:
Red:
Users: at least one user has anomalies in the selected duration
Devices: at least one active device is non-compliant in the selected duration
Gateways: as described above
Non-compliance: if the count is non-zero
Anomalies: if the count is non-zero
Users Map View
In the world map Users tab, each location shows the number of active users in that location.
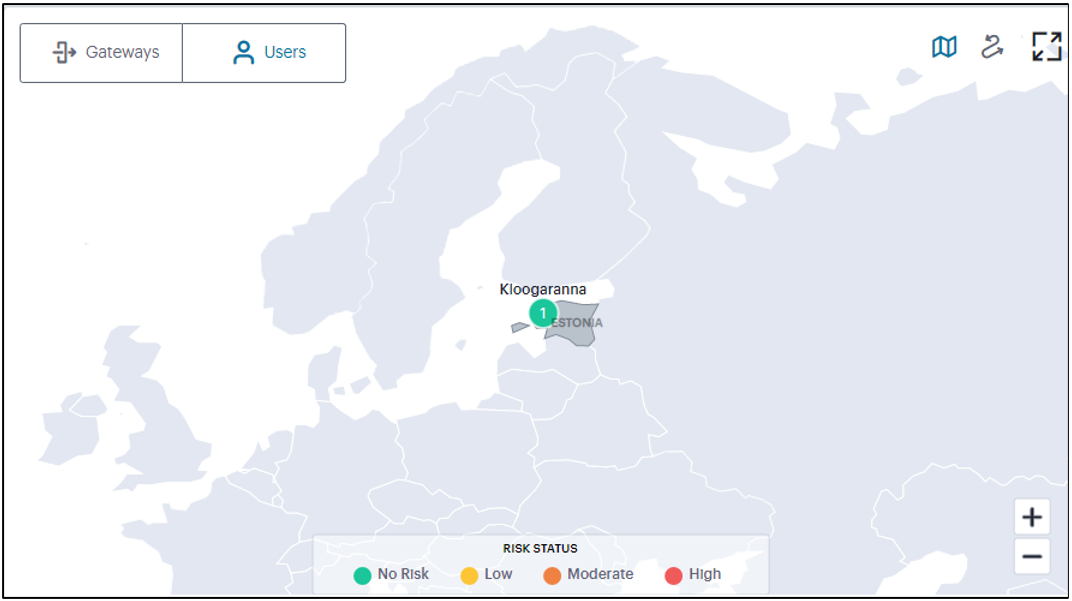
FIGURE 40 Viewing the world map - Users
Use the Plus (+) and Minus (-) controls to zoom in and out of the world map, allowing you to select the desired level of detail. Alternatively, use your pointer to manipulate the map display. Double-click/tap an open area of the map to zoom in, or reposition the map display through drag and drop.
To toggle between the Map view and Sankey chart view, use the icons at the top-right:
FIGURE 41 Toggle between Map view and Sankey chart view
The color of the location shows the average UEBA Threat scores of the active users in that location:
Green (No Risk) - UEBA Threat score < 10
Yellow (Low) - UEBA Threat score > 10 < 20
Orange (Medium) - UEBA Threat score > 20 < 30
Red (High) - UEBA Threat score > 30
Hover on a user location to view detailed UEBA Threat scores of the users in that users location.
By hovering on a User location, the current Users’ status is indicated by the color scheme shown in the legend.
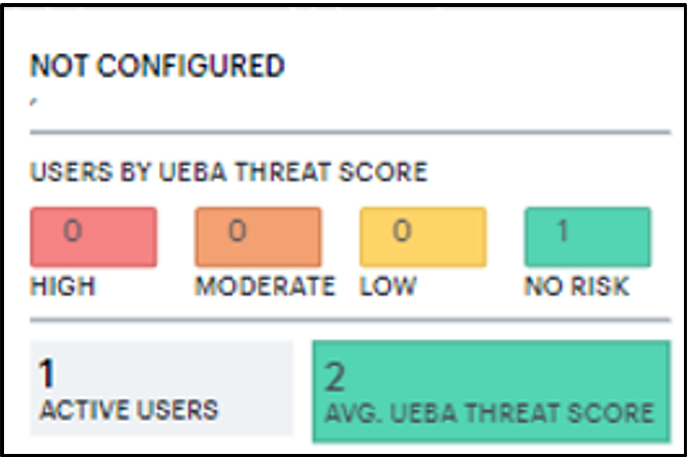
FIGURE 42 Viewing current users status
Click a location bubble to display a sliding info-panel dialog for the Users at that location.
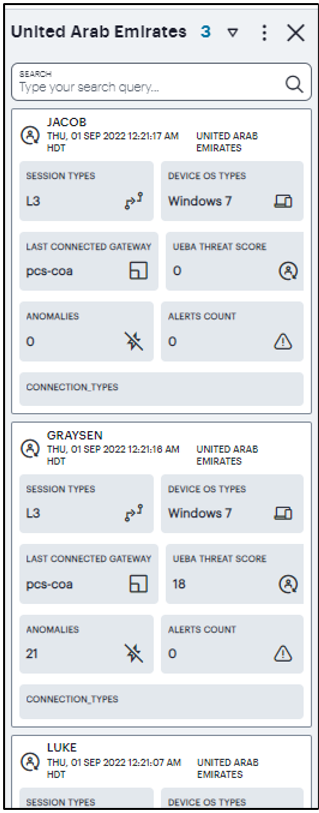
FIGURE 43 Viewing the Users info-panel
The panel displays the following details:
Session type
Device OS type
Last connected gateway
Average UEBA Threat score
Anomalies
Alerts count
Using the Sankey Chart View
The Network Sankey chart provides an alternate visualization of your services, showing directed flow between related objects. The width of each stream in the flow is proportional to the utilization of the object the flow passes through, allowing an administrator to view significant usage and relationships across your user base and application infrastructure.
To activate the Sankey chart view, use the toggle icons at the top-right:
FIGURE 44 Toggle between Map view and Sankey chart view
By clicking the toggle display icon, the Sankey chart replaces the world map in the display. All other components remain unchanged.
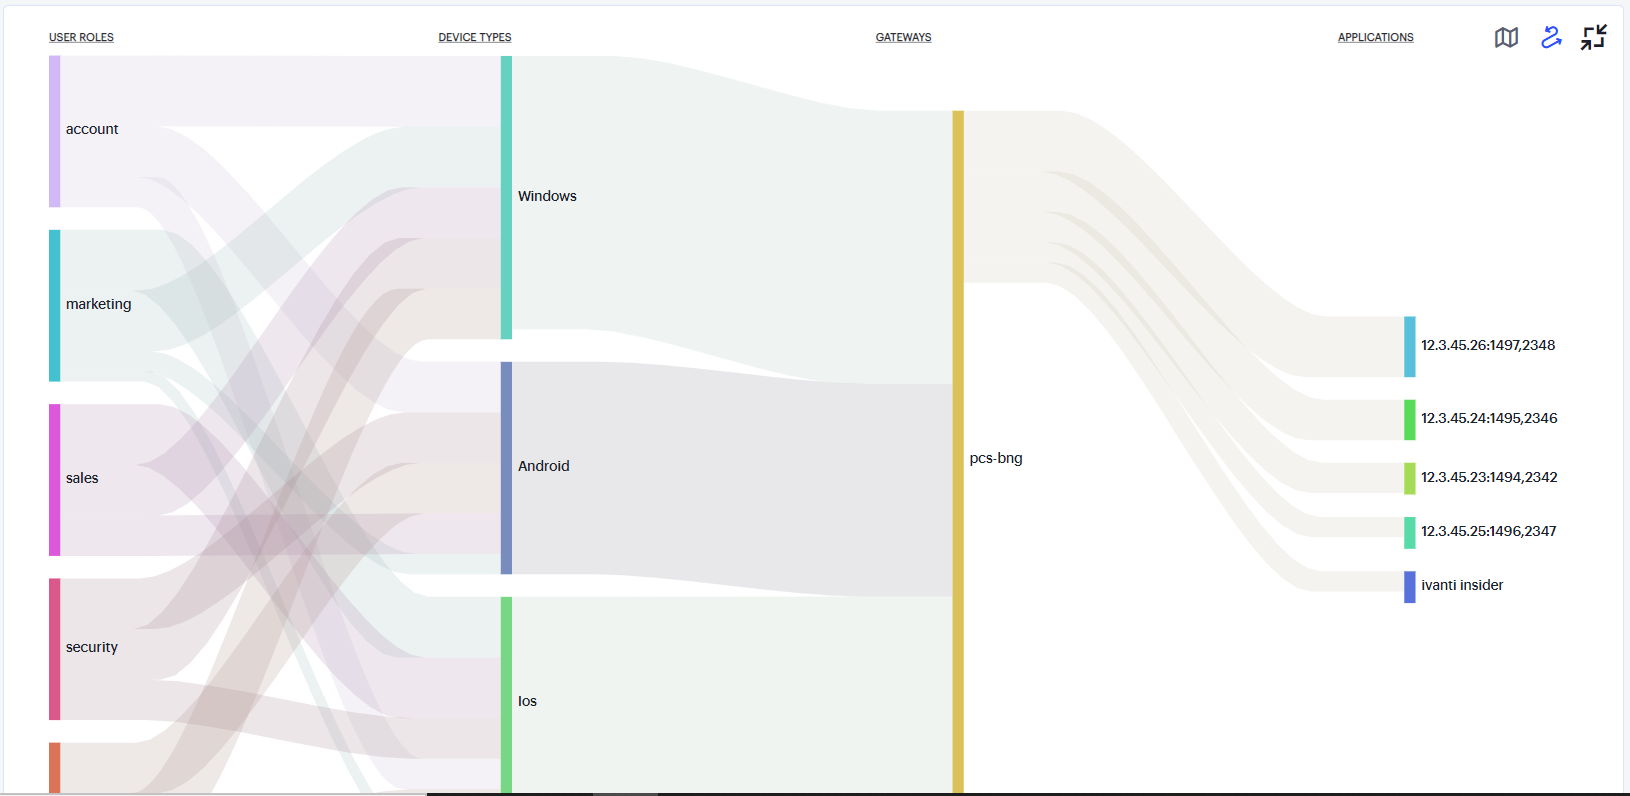
FIGURE 45 Displaying the Network Overview Sankey Chart View
The Ivanti Connect Secure Sankey chart maps User Roles > Device Types > Gateways > Applications. By hovering your pointer over a flow of interest, Ivanti Connect Secure displays a tooltip confirming the scale of the activity between the two objects connected by the flow.
To focus the display on a specific flow, or to identify related objects that interact with this flow, click the chart at a point of interest. Ivanti Connect Secure provides highlighting to all flows that pass through the point selected.
Using the Sessions, Non-Compliances, Connected Clients Version and Pre-Auth Non-Compliances Charts
The Network Overview page includes bar charts to provide a breakdown of Sessions, Non-Compliances, Connected Clients Version and Pre-Auth Non-Compliances events.
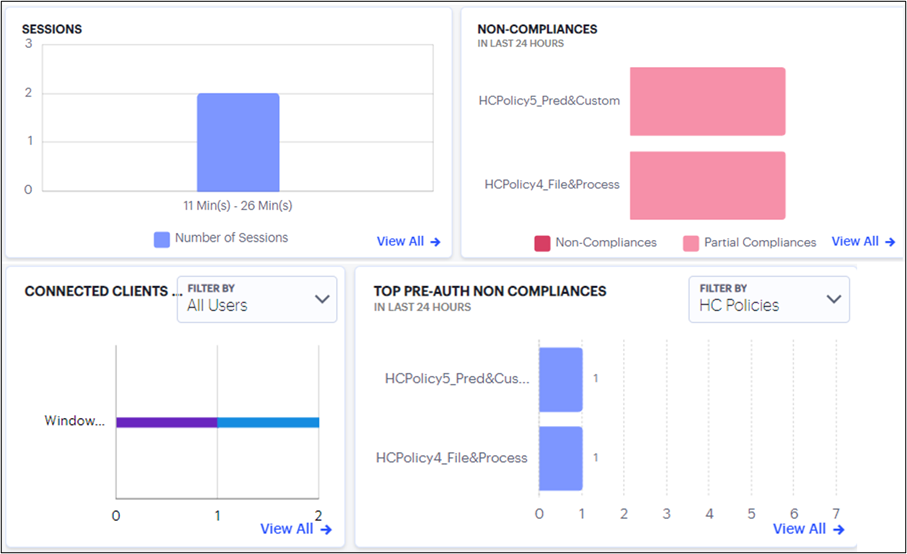
FIGURE 46 Viewing a breakdown of Active Anomalies and Non-compliance
The Sessions chart provides the total number of sessions over a period. That is, user sessions that took place during the period.
To view a detailed list of events that contributed to the totals, click View all:
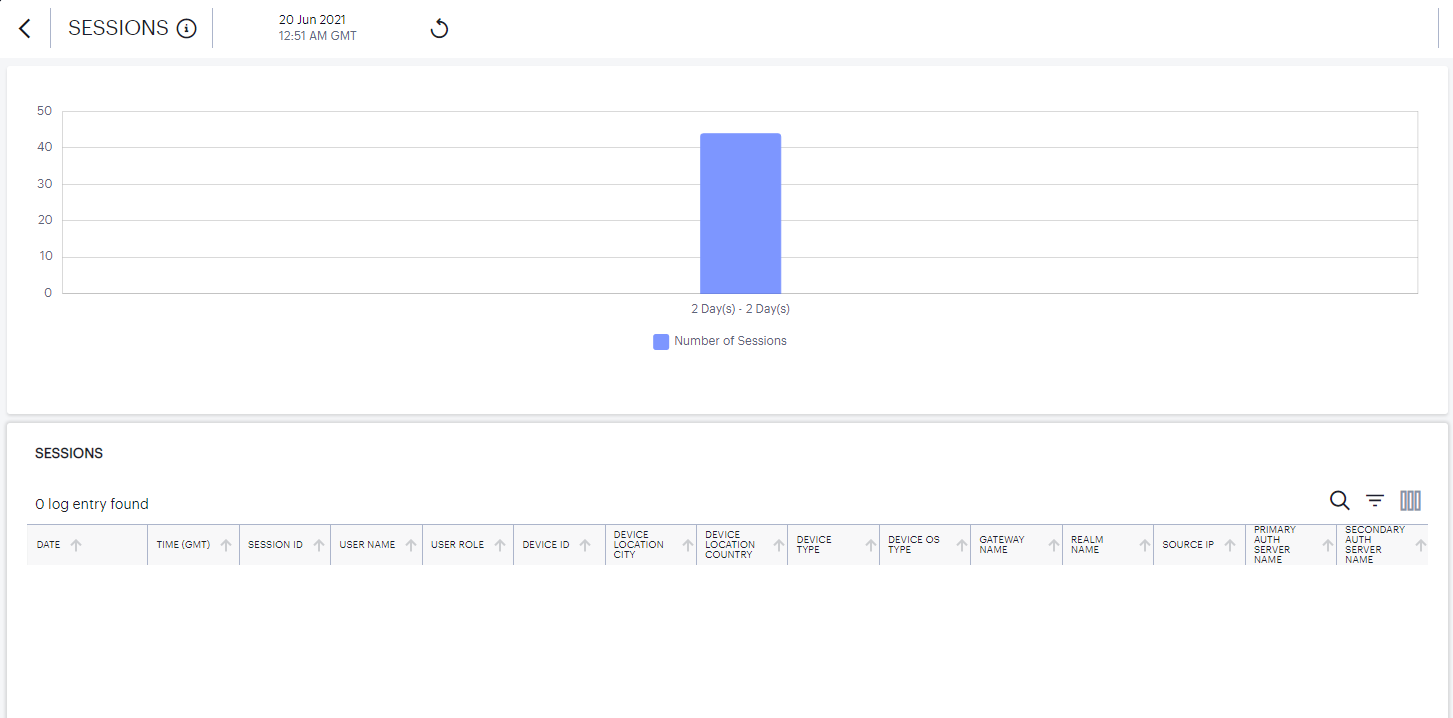
FIGURE 47 Viewing Sessions events
The Non-compliances chart provides a breakdown of non-compliant device activity that contravened a configured device policy. Totals are given for the highest policy contraventions recorded during the period.
To view a detailed list of events that contributed to the totals, click View all:
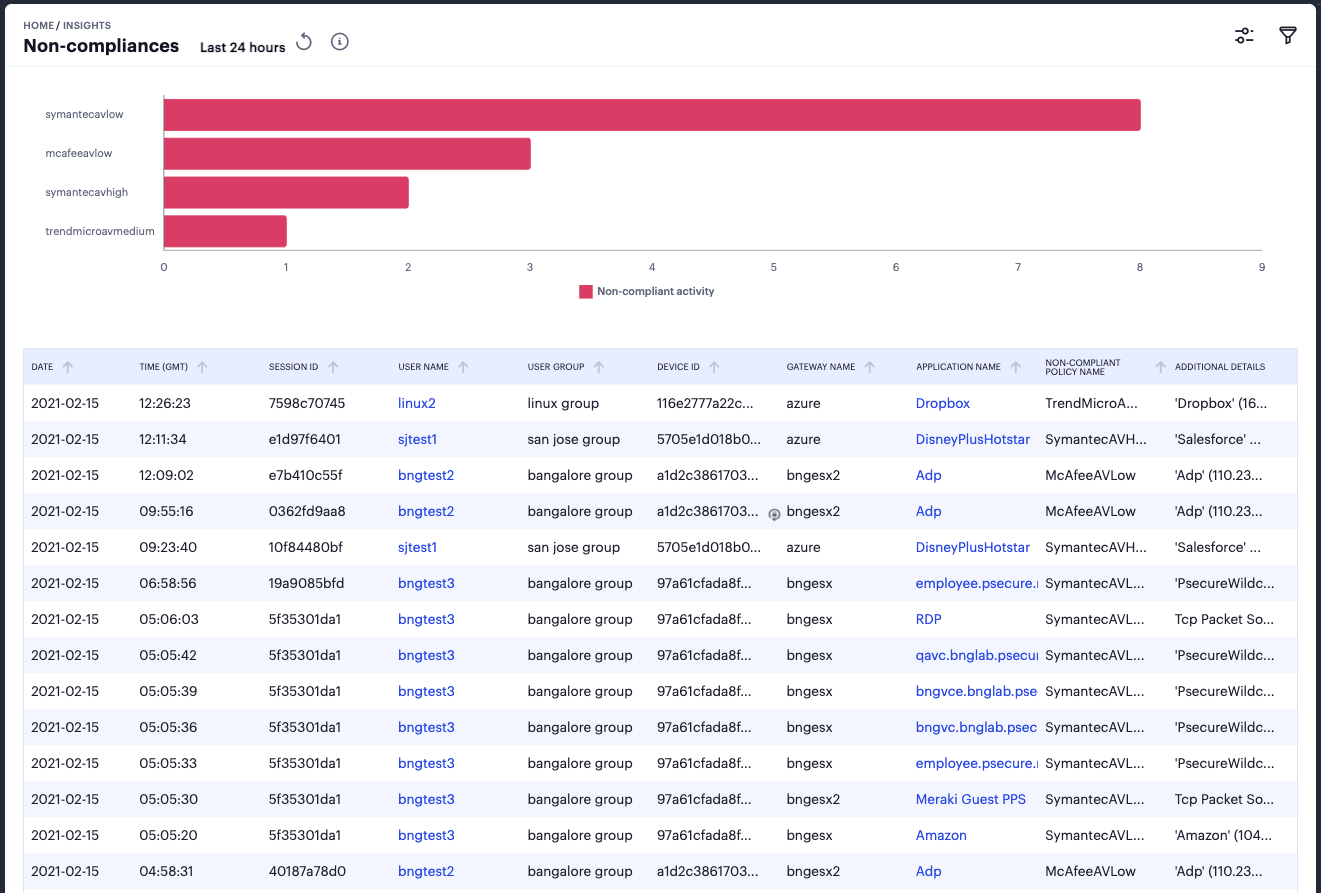
FIGURE 48 Viewing Non-compliances events
Click on the legend labels to toggle that element on or off in the chart. Use your pointer to scroll the event messages pane to view more details in the columns to the right.
The Connected Clients Version chart provides the distribution of various versions of Ivanti Secure Access client across different device OS in the tenant.
You can view the chart based on Active Users for Ivanti Secure Access client versions distribution from the currently active sessions or All Users for Ivanti Secure Access client versions distribution from the sessions in the last 30 days.
To view a detailed list of events that contributed to the totals, click View all:

FIGURE 49 Viewing Connected Clients Version Details
The Pre-Auth Non-Compliances provides the occurrences of non-compliance in the last 24 hours, in the tenant even before the authentication.
You can view the chart based on Device Types, User Locations, Gateways and HC Policies.
To view a detailed list of events that contributed to the totals, click View all:
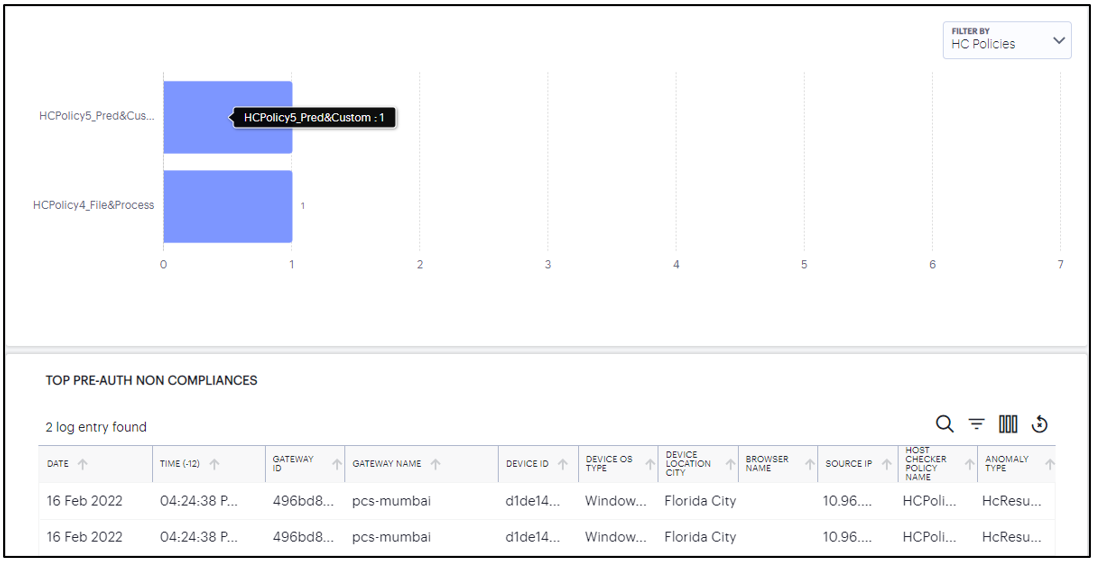
FIGURE 50 Viewing Pre-Auth Non-Compliances Details
Using the Top Active Breakdown Charts
The radar charts at the bottom of the page show a breakdown of Gateways, Device Types, and User Locations across your organization. Each chart shows the top active items in each category.
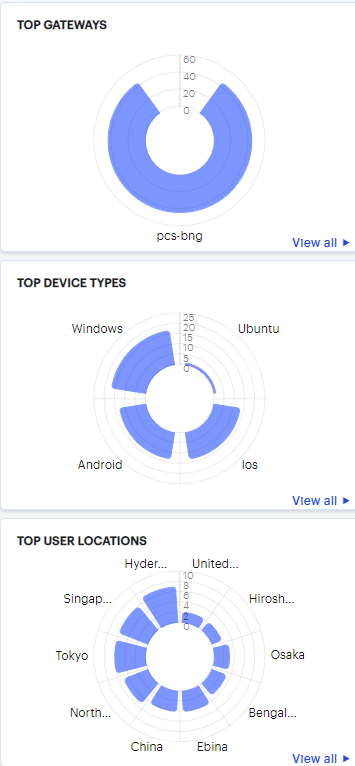
FIGURE 51 Viewing the breakdown radar charts
Hover your pointer over a particular element to view a tooltip showing the label and total. To view more details for a chart, click the corresponding View all link. For example:
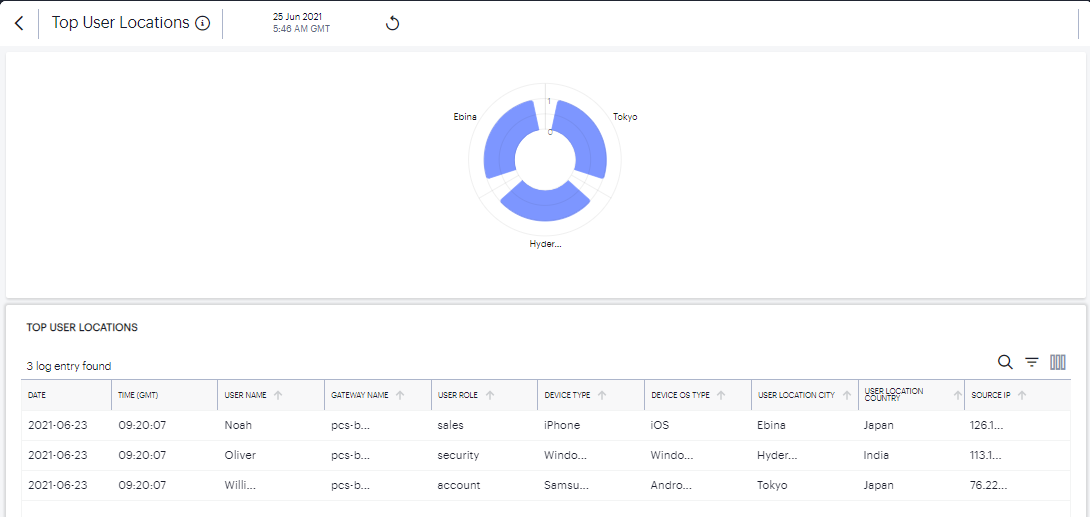
FIGURE 52 Viewing details for the top active User Locations
Click the View All link that provides access to a detailed view showing logs for the corresponding chart.
In the detailed log page:
Double-click on any log to view additional details of that log in the Info Panel to the right.
Use the Group by option and select the field type to view the table information in groups. Then click > to view the logs in that group.

FIGURE 53 Group by icon
Use the Advanced Filter icon to view logs based on the pre-defined filter, operator and value.
Advanced Filtering
In the logs section, click the Advanced Filter icon and view logs based on the pre-defined filter, operator and value.
To create a custom filter:
Click the Advanced Filter icon to open the Advanced Filter window.

FIGURE 54 Advanced Filtering
Choose the required column from the Filter by list, select an operator, enter a value and click Add.
Repeat to add more filters if required.
Enter a name for the filter and click Save. The new filter will be listed in the Filters list.
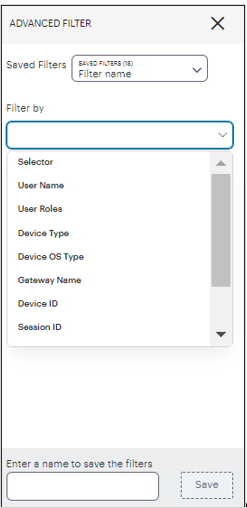
FIGURE 55 Creating Advanced Log Filter
To load a previously-saved filter, select your filter from the Saved Filters drop-down list and click Apply.
When you apply a filter, the filter information is retained in the new session/login.
You can individually remove filters that are applied on the table or you can use the Reset Filter icon to clear all the filters applied on the table.
To delete one or more previously-saved filters, select the filters from the Saved Filters drop-down list and click Delete.
Reviewing Users Activity
The Users Overview page shows activity relating to users in your Ivanti Connect Secure deployment.
To access the Users Overview page:
Log in to the Ivanti Neurons for Secure Access Admin portal as a Tenant Admin, and select Ivanti Connect Secure from the Gateway Switcher. See Logging in to Ivanti Neurons for Secure Access.
The Network Overview page appears by default.
From the Ivanti Connect Secure menu, click the Insights icon, then select Users.
The Users Overview page appears.
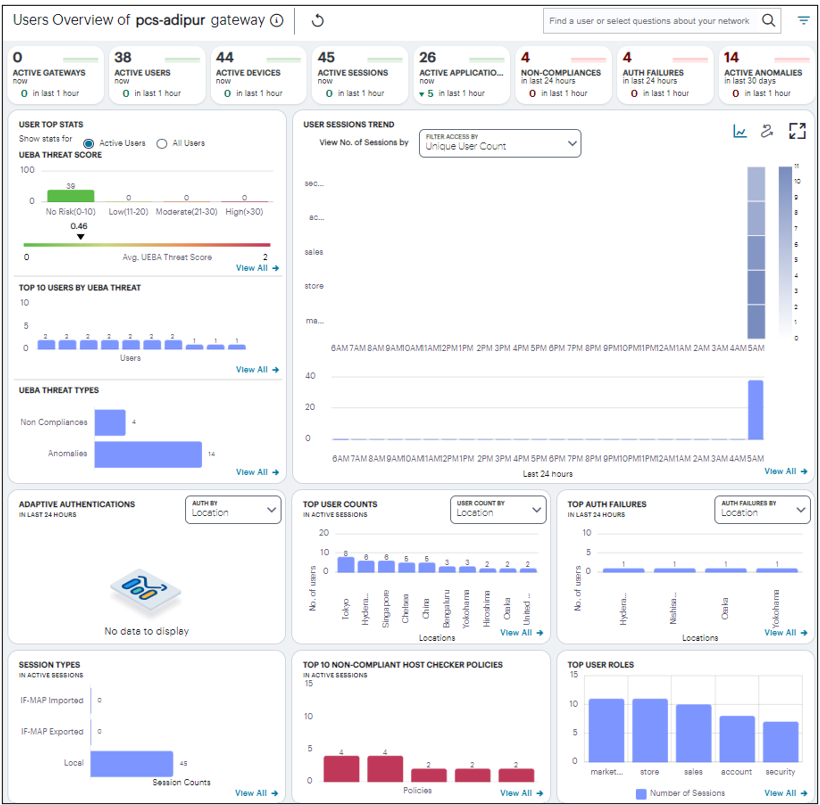
FIGURE 56 An overview of activity for all users
Understanding the Display
The Users Overview page contains the following components:
Filter bar, allowing the selection of active or data. For details, see Using the Filter Bar.
Summary ribbon, showing metrics for user activity. For more details, see Viewing the Users Summary Ribbon.
User Top Stats, Top 10 Users By UEBA Threat, UEBA Threat Types, showing graphs and metrics for UEBA Threat scores across your user groups. For more details, see Viewing a Summary of UEBA Threat Scores for your Users.
User Session Trends, showing a timeline chart of user sessions. For more details, see Viewing the Users Session Trend.
Activity charts, showing charts for Adaptive authentication, Top user count, Top auth failures, and Session types.
Each chart on this page includes a View All link. This link provides access to a detail view showing logs for the corresponding chart. For example:
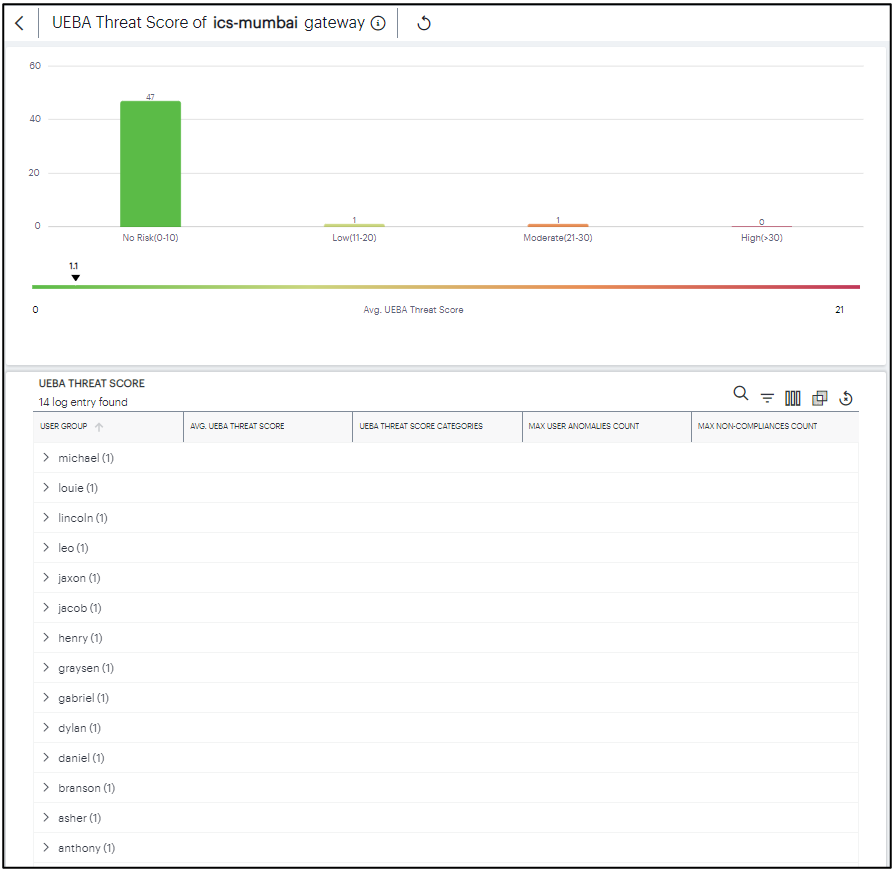
FIGURE 57 Viewing UEBA Threat Score detailed logs
Each detail view shows logs for the corresponding chart or category. For each column, click the arrow icon adjacent to the column name to sort in ascending or descending order. Use your pointer to scroll the log messages pane to view more details in the columns to the right.
Where a log message is too long for the display, hover your pointer over the message to view a tooltip containing the full text. Furthermore, to view a single log entry in a dedicated panel, click the log message text to activate the info-panel view.
Using the Filter Bar
Ivanti Connect Secure uses the top part of the display on all Insights data analysis pages to show the current page title, the default time period, and options to:
Manually refresh the data
Set a filter for a specific Ivanti Connect Secure gateway
Ask a predefined question (Intent):
Show me Top Risky Users
Show me users with Geo Anomaly
Show me user roles with most Non-Compliances
Show me top users with Auth Failures
Show me users with MFA
By default, analytics data on this page and others is shown for the last hour or current day. To manually refresh the data, click the circular arrow:
FIGURE 58 Refreshing the data
Ivanti Connect Secure provides the ability to show focused metrics for a specific Ivanti Connect Secure Gateway. To select a specific gateway, use the filter icon:
FIGURE 59 The Filter icon
In the Filter panel, from the drop-down list select the required gateway and click Apply. To clear the selection, click Clear All.
Viewing the Users Summary Ribbon
The Summary ribbon at the top of the Users Overview page shows activity totals for the selected time filter:

FIGURE 60 Viewing the Summary Ribbon
The ribbon indicates the totals accrued for each category during the displayed time period, as indicated adjacent to the category name. Hover your pointer over the category elements to show a descriptive tooltip.
Active Gateways: The total number of active Ivanti Connect Secure Gateways.
Active Users: The number of active users during the selected time period.
Active Devices: The number of active devices.
Active Sessions: The number of active sessions.
Active Applications: The number of in-use applications.
Non-Compliances: The number of non-compliant sessions (full/partial non-compliant) across all gateways in the last 24 hours.
Auth failures: The number of authentication failures in the last 24 hours.
Active Anomalies: The number of anomalies detected by Ivanti Connect Secure in the last 30 days.
By default, the data presented in the ribbon corresponds to the current day, since midnight GMT. The number of hours over which the data applies is displayed in each category. To change the time period, use the filter bar (see Using the Filter Bar).
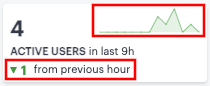
FIGURE 61 Data trends for last full hour versus the previous hour
Viewing a Summary of UEBA Threat Scores for your Users
On the Insights > Users page, the User Top Stats panel displays information concerning UEBA threat across your user base:
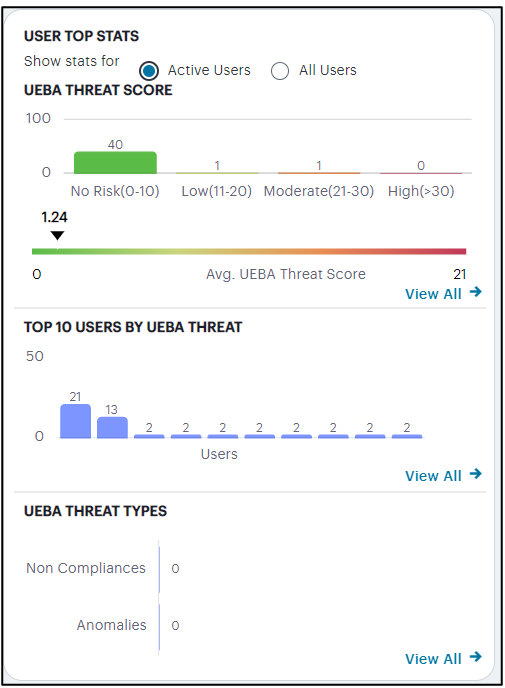
FIGURE 62 Viewing user group UEBA threat data
The User Top Stats contains:
Active Users tab to view user stats of the active users.
All Users tab to view user stats that include users logged in for the last 30 days.
The panel provides:
A breakdown of UEBA threat by user.
The average UEBA threat score across all users.
The top-10 users scoring highest for UEBA threat. It also shows the UEBA threat score threshold set, to terminate the user sessions with applicable rule on reaching the permissible limit.
A break-down of UEBA threat types.
The policies with highest non-compliance.
A user’s UEBA Threat score is calculated from a combination of:
Application access attempts originating from anomalous geographic locations.
Non-compliant user devices that attempted to access your applications.
Each additional incident increments a user’s overall UEBA Threat score.
The No. of users chart provides a visual indication of the number of users that fall into each of the UEBA Threat categories. These categories are shown as a range of UEBA Threat scores and number of users. The upper and lower bands for each category are shown in brackets. The categories are:
No risk (0-10)
Low (11-20)
Moderate (21-30)
High (>31)
Note
Where a particular threat category matches no users for the selected time period, that category label is not shown.
Below this chart, Ivanti Connect Secure displays the Average UEBA Threat Score for all users on a scale between zero UEBA Threat and the highest UEBA Threat score measured at the end of the current time period.
Note
The maximum value shown in the chart corresponds to the highest UEBA Threat score for all users as they stand at the end of the time period, not the highest they have been within that period.
The Top 10 Users by UEBA Threat Score chart shows the top-10 users with the highest cumulative UEBA Threat score across the selected time period. Hover your pointer over each bar in the chart to see the name of the corresponding user.
The UEBA Threat Type chart provides a breakdown of all geolocation anomalies and non-compliances that occurred during the selected time period.
The Top Policies with Non-compliances chart shows the device policies that recorded the highest number of non-compliances for the active users. Hover your pointer over each bar in the chart to see the name of the corresponding policy.
Viewing the Users Session Trend
Ivanti Connect Secure uses this section to show user sessions trends that occurred during the period:
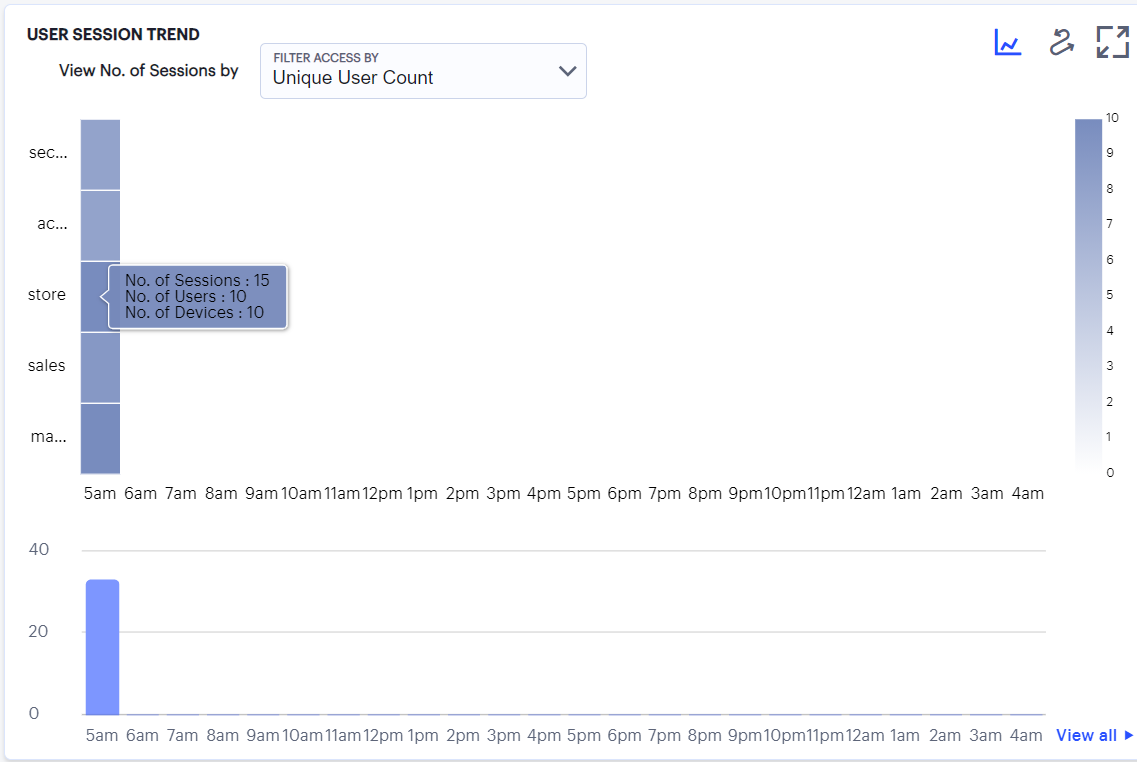
FIGURE 63 Viewing top user sessions trends
You can choose to display this information through bar charts (as shown), or in a Sankey chart. Use the toggle icon at the top-right to select the required view:
FIGURE 64 Toggle between bar chart view and Sankey chart view
To expand the current view, click the Full Screen icon:
FIGURE 65 Expand the current view
In bar chart view, the bar chart shows one of following data types, selected using the drop-down control:
Unique User Count
Unique Session Count
Unique Device Count
In the Sankey chart view, Ivanti Connect Secure provides an alternate visualization of user sessions, showing directed flow between related objects.
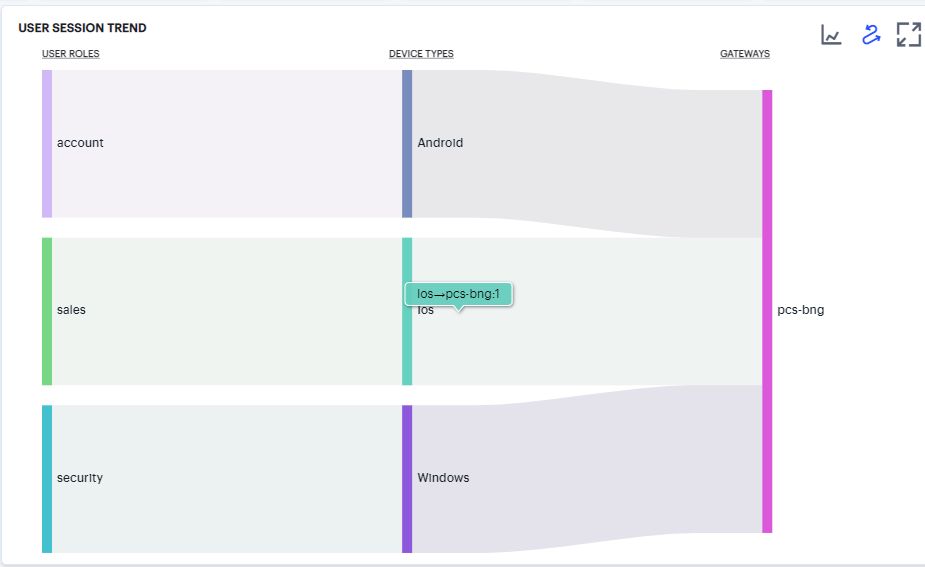
FIGURE 66 User Session Trends Sankey chart
The chart maps User Roles > Device Types > Gateways. By hovering your pointer over a flow of interest, Ivanti Connect Secure displays a tooltip confirming the scale of the activity between the two objects connected by the flow.
To focus the display on a specific flow, or to identify related objects that interact with this flow, click the chart at a point of interest. Ivanti Connect Secure provides highlighting to all flows that pass through the point selected.
Viewing the Users Activity Charts
Ivanti Connect Secure provides charts to represent user activity:
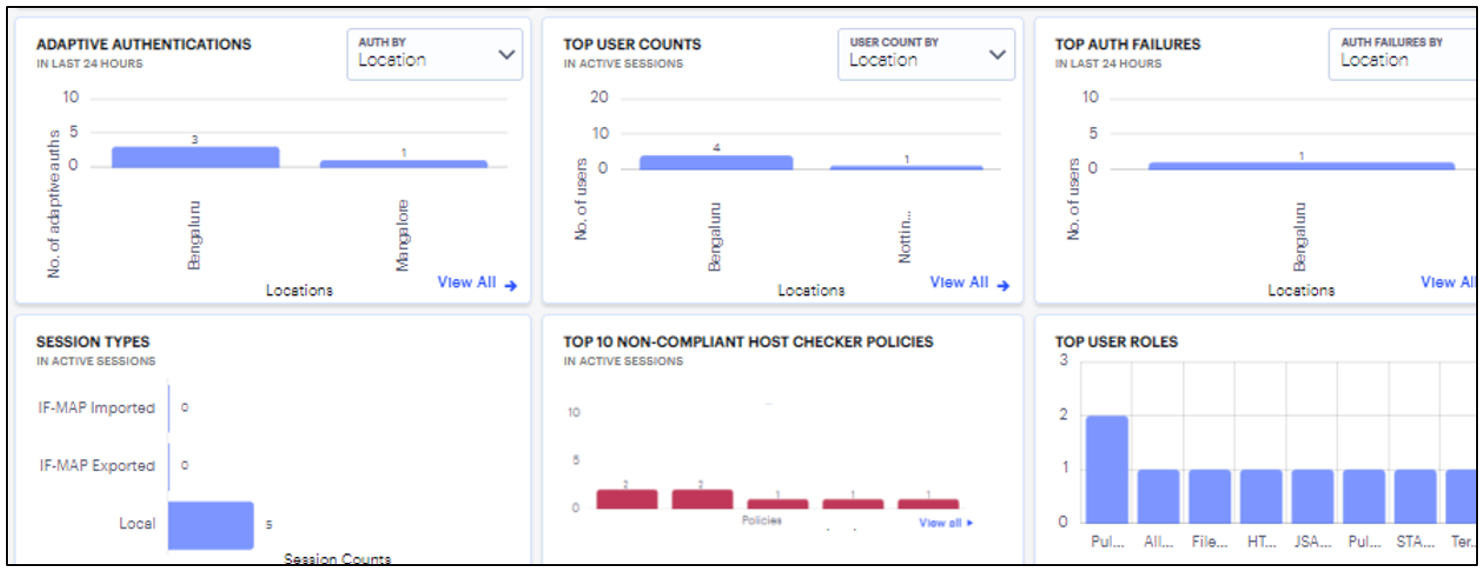
FIGURE 67 Viewing Activity Charts
Adaptive Authentications: a chart of adaptive authentication in the last 24 hours based on Location, Realm, or Reason.
Top User Counts: a chart showing users that accrued the highest number of successful accesses based on Location, Auth Server, Gateway, Device Type or Session.
Top Auth Failures: a chart of authentication failures observed based on the Location, Auth Server, or Gateway.
Session Types: a chart showing number of Imported IF-MAP sessions, Exported IF-MAP sessions and Local sessions.
Top 10 Non-Compliant Host Checker Policies: a chart showing the top 10 host checker policies that recorded the highest number of non-compliances.
Top User Roles: a chart showing the totals for the number of user roles such as marketing, sales, account, security, store.
Click the View All link that provides access to a detailed view showing logs for the corresponding chart.
In the detailed log page:
Double-click on any log to view additional details of that log in the Info Panel to the right.
Use the Group by option and select the field type to view the table information in groups. Then click > to view the logs in that group.
FIGURE 68 Group by icon
Use the Advanced Filter icon to view logs based on the pre-defined filter, operator and value.
Advanced Filtering
In the logs section, click the Advanced Filter icon and view logs based on the pre-defined filter, operator and value.
To create a custom filter:
Click the Advanced Filter icon to open the Advanced Filter window.
FIGURE 69 Advanced Filtering
Choose the required column from the Filter by list, select an operator, enter a value and click Add.
Repeat to add more filters if required.
Enter a name for the filter and click Save. The new filter will be listed in the Filters list.
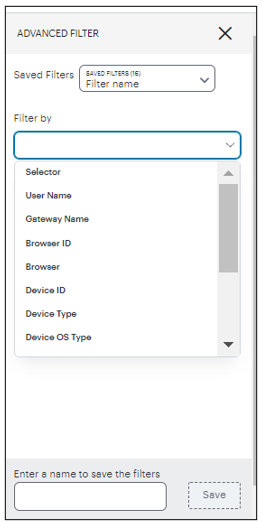
FIGURE 70 Creating Advanced Log Filter
To load a previously-saved filter, select your filter from the Saved Filters drop-down list and click Apply.
When you apply a filter, the filter information is retained in the new session/login.
You can individually remove filters that are applied on the table or you can use the Reset Filter icon to clear all the filters applied on the table.
To delete one or more previously-saved filters, select the filters from the Saved Filters drop-down list and click Delete.
Reviewing Application Usage
Applications are defined primarily by the URI you use to access them, and can be fully defined (for example, a complete URI denoting a specific application at a location).
Ivanti Connect Secure provides views for your application usage metrics for all defined applications in your Ivanti Connect Secure deployment..
To view application usage:
Log in to the Ivanti Neurons for Secure Access Admin portal as a Tenant Admin, and select Ivanti Connect Secure from the Gateway Switcher. See Logging in to Ivanti Neurons for Secure Access.
The Network Overview page appears.
From the Ivanti Connect Secure menu, click the Insights icon, then select Applications.
The Applications Overview page appears, showing the selected metrics.
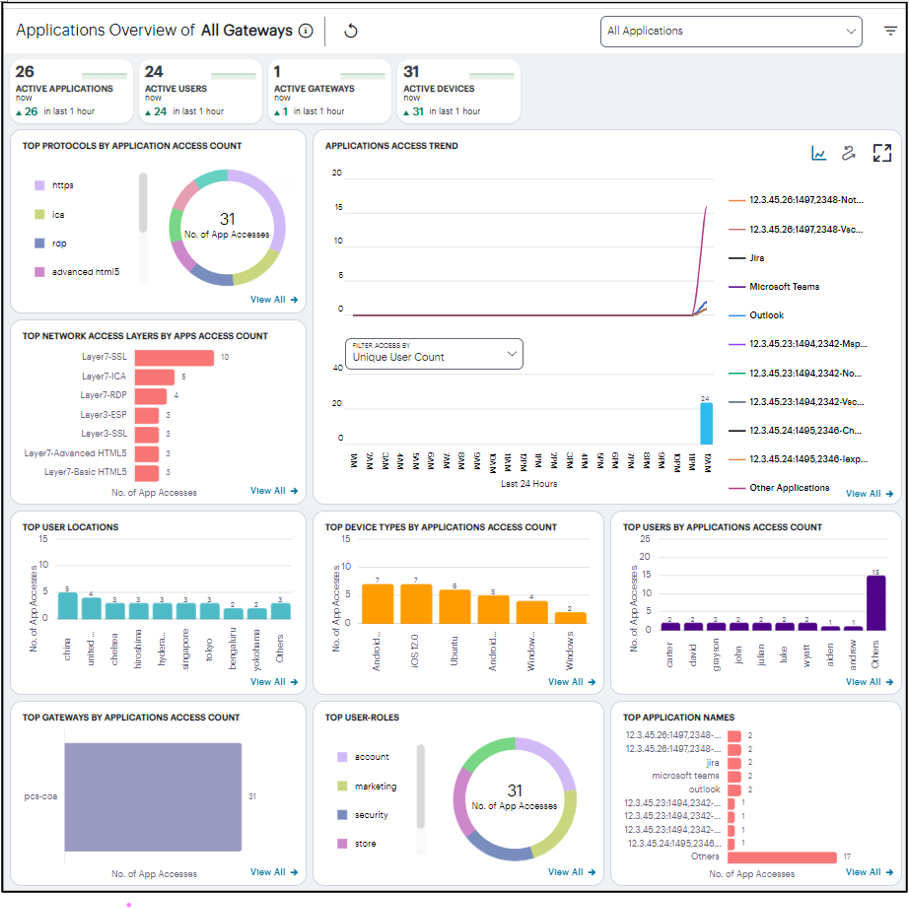
FIGURE 71 Viewing usage charts and graphs for your applications
Understanding the Display
The Applications page contains the following components:
Filter bar, allowing the selection of Ivanti Connect Secure Gateway. For details, see Using the Filter Bar.
Summary ribbon, showing details of the selected gateway. For more details, see Using the Applications Summary Ribbon.
Top Protocols by Application Access Count, showing number of top protocols that attracted the greatest number of application accesses. For more details, see Viewing Top Protocols by Application Access.
Applications Access Trend, showing applications accesses trends that occurred over a period. For more details, see Viewing Applications Access Trend.
Activity charts, showing application access details of Top Network Access Layers, Top User Locations, Top Device Types, Top Users, Top Gateways, Top User Roles, and Top Application Names. For more details, see Viewing the Activity Charts.
Each chart on this page includes a View All link. This link provides access to a detail view showing logs for the corresponding chart. For example:
Using the Filter Bar
Ivanti Connect Secure uses the top part of the display on all Insights data analysis pages to show the current page title, the default time period, and options to:
Manually refresh the data
Set a filter for a specific Ivanti Connect Secure Gateway
Select Layer 3 and Layer 7 Applications
By default, analytics data on this page and others is shown for the last hour or current day. To manually refresh the data, click the circular arrow:
FIGURE 72 Refreshing the data
Ivanti Connect Secure provides the ability to show focused metrics for a specific Ivanti Connect Secure Gateway. To select a specific gateway, use the filter icon:
FIGURE 73 The Filter icon
In the Filter panel, from the drop-down list select the required gateway and click Apply.
To clear the selection, click Clear All.
Ivanti Connect Secure provides the ability to show focused metrics for Layer 3 and Layer 7 applications. By default, data on this page shows for All Applications. Select the required application access from the list to view the corresponding charts and trends in the Applications page. Within Layer 3 Applications, you can choose ESP or SSL applications.
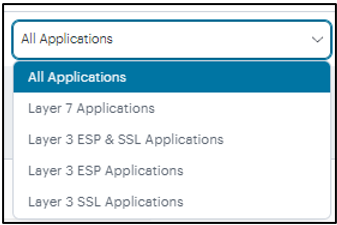
FIGURE 74 The Layer 3 and Layer 7 Applications Selection
Using the Applications Summary Ribbon
The Summary ribbon provides the following metrics:
Active Applications: The total number of active applications defined on the Ivanti Connect Secure.
Active Users: The number of active users.
Active Gateways: The number of active Gateways.
Active Devices: The number of active devices.
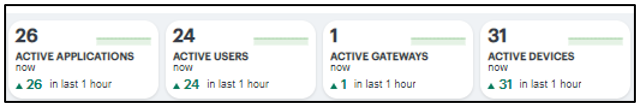
FIGURE 75 Viewing Summary Ribbon
Viewing Top Protocols by Application Access
The Top Protocols by Application Access Count radar chart shows the top protocols that attracted the greatest number of application accesses during the period (for example, Web, RDP, SSH or Bookmark).
Hover your pointer over each bar to display a tooltip of the protocol type and number of accesses recorded.
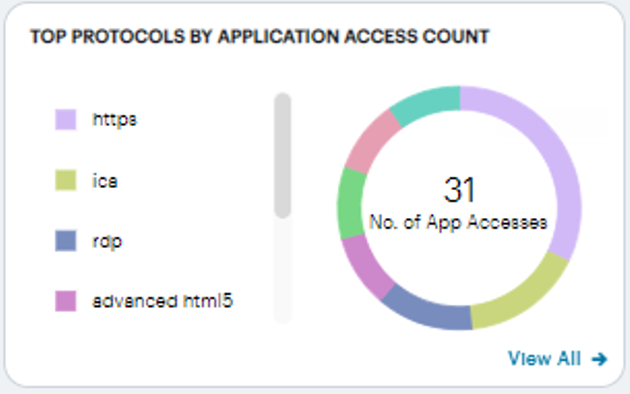
FIGURE 76 Viewing Top Protocols by Application Access
To view a detailed list of events that contributed to the totals, click View all.
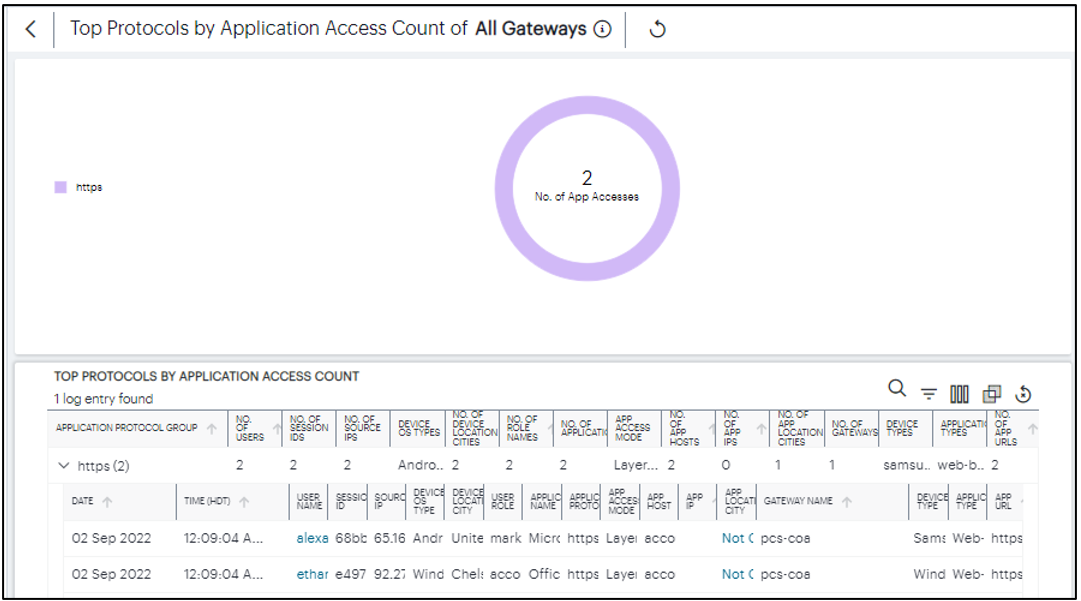
FIGURE 77 Viewing Top Protocols by Application Access Detailed View
Viewing Applications Access Trend
The Applications Access Trend panel shows application access trends that occurred during the period. Choose to display this information through line and bar charts, or in a Sankey chart.
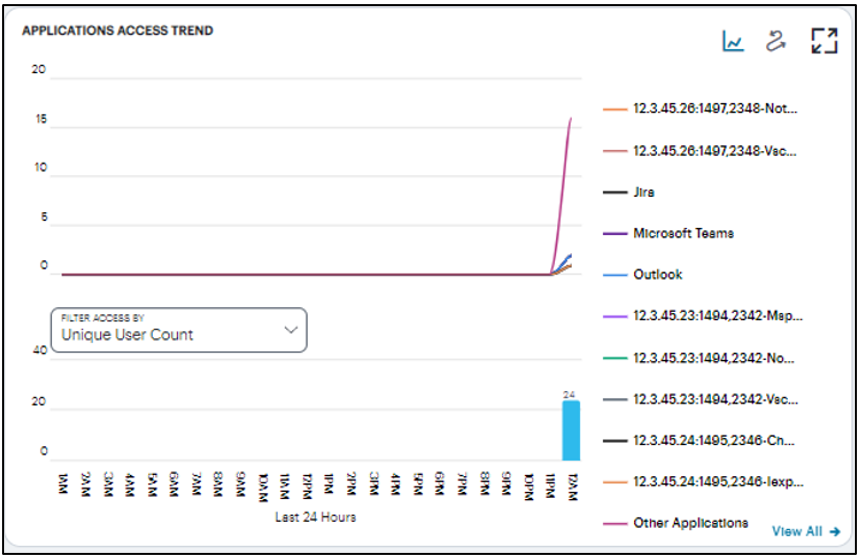
FIGURE 78 Viewing Web Bookmark Access Trend
Use the toggle icon at the top-right to select the required view. Also at the top-right, use the full-screen icon to toggle the current view between normal and full screen.
In line/bar chart view:
The display is split into two charts:
A line chart showing the number of accesses for the top-10 applications during each hourly period of the day
A bar chart showing one of four data types, selected using the Filter Access By drop-down control:
Unique User Count: Shows a count of unique user activity identified during each hourly period.
Unique Device Type Count: Shows a count of unique device types identified during each hourly period.
Unique Location Count: Shows a count of activity from unique user locations identified during each hourly period.
Unique User Group Count: Shows a count of activity from unique user groups identified during each hourly period.
In this chart, you can:
Hover your pointer over each hourly interval to view a tooltip showing the corresponding data totals.
Click and drag a select box across a shorter time period to zoom in on a narrower time window. To return to the full 24 hour period, click the zoom out icon.
Click the corresponding line in the graph to view only the data for that specific user group.
Using the Sankey Chart View
The Sankey chart provides an alternate visualization of application access activity, showing directed flow between related objects. The width of each stream in the flow is proportional to the utilization of the object the flow passes through, allowing an administrator to view significant usage and relationships across your user groups and application infrastructure.
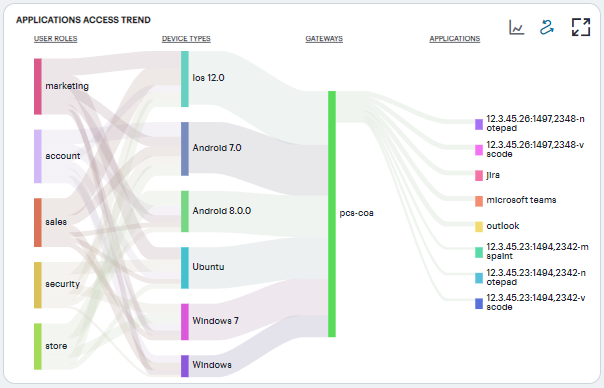
FIGURE 79 Viewing Applications Access Trend
Hover your pointer over a flow of interest to display a tooltip confirming the scale of the activity between the two objects connected by the flow.
To focus the display on a specific flow, or to identify related objects that interact with this flow, click the chart at a point of interest. Ivanti Connect Secure provides highlighting to all flows that pass through the point selected.
Viewing the Activity Charts
The Activity Charts on this page represent top application access totals in the following categories:
Top Network Access Layers by Apps Access Count: a bar chart showing the count of Layer 3 and Layer 7 applications accesses.
Top User Locations: a bar chart showing the count of application accesses made from various user locations.
Top Device Types by Applications Access Count: a bar chart showing a count of number of applications accesses made from various devices.
Top Users by Applications Access Count: a bar chart showing a count of number of applications accesses made by the users.
Top Gateways by Applications Access Count: a bar chart showing a count of number of applications accesses made from Gateways.
Top User Roles: a bar chart showing the count of application accesses made by various user roles (example: Marketing, Sales, Accounts, Security).
Top Application Names: a bar chart showing the count of application accesses made to various applications (example: Microsoft Teams, Outlook).
Hover your pointer over a particular element to view a tooltip showing the label and total.
Use the Filter to view active access count by Gateway, Device Type, User Name, User Role, or User Location City.
Click the View All link that provides access to a detailed view showing logs for the corresponding chart.
In the detailed log page:
Double-click on any log to view additional details of that log in the Info Panel to the right.
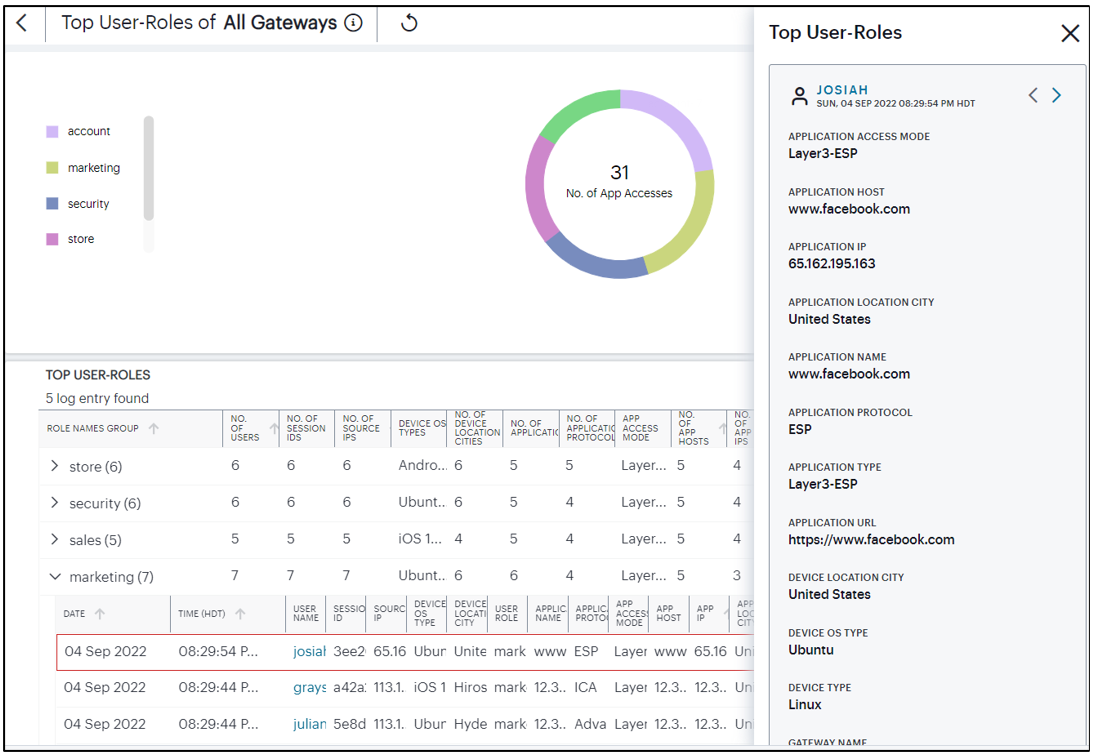
FIGURE 80 Viewing details in Info Panel
Double-click on any log to view additional details of that log in the Info Panel to the right.
Use the Group by option and select the field type to view the table information in groups. Then click > to view the logs in that group.
FIGURE 81 Group by icon
Use the Advanced Filter icon to view logs based on the pre-defined filter, operator and value.
Advanced Filtering
In the logs section, click the Advanced Filter icon and view logs based on the pre-defined filter, operator and value.
To create a custom filter:
Click the Advanced Filter icon to open the Advanced Filter window.
FIGURE 82 Advanced Filtering
Choose the required column from the Filter by list, select an operator, enter a value and click Add.
Repeat to add more filters if required.
Enter a name for the filter and click Save. The new filter will be listed in the Filters list.
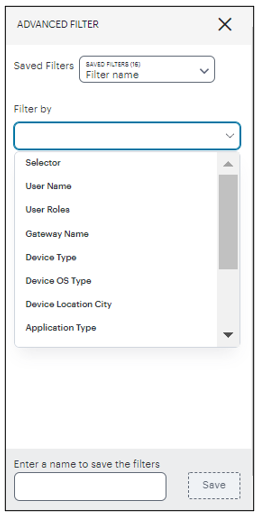
FIGURE 83 Creating Advanced Log Filter
To load a previously-saved filter, select your filter from the Saved Filters drop-down list and click Apply.
When you apply a filter, the filter information is retained in the new session/login.
You can individually remove filters that are applied on the table or you can use the Reset Filter icon to clear all the filters applied on the table.
To delete one or more previously-saved filters, select the filters from the Saved Filters drop-down list and click Delete.
Configuring nZTA Policy to an ICS Application
Administrators can now configure ICS application with nZTA Secure Access Policy from the nSA-ICS Applications page. This feature requires nZTA license. The Secure Access Policy defines how end users can connect to nSA to access applications.
A Configure button is provided in the ICS Applications page to configure nZTA Secure Access Policy to an ICS application.
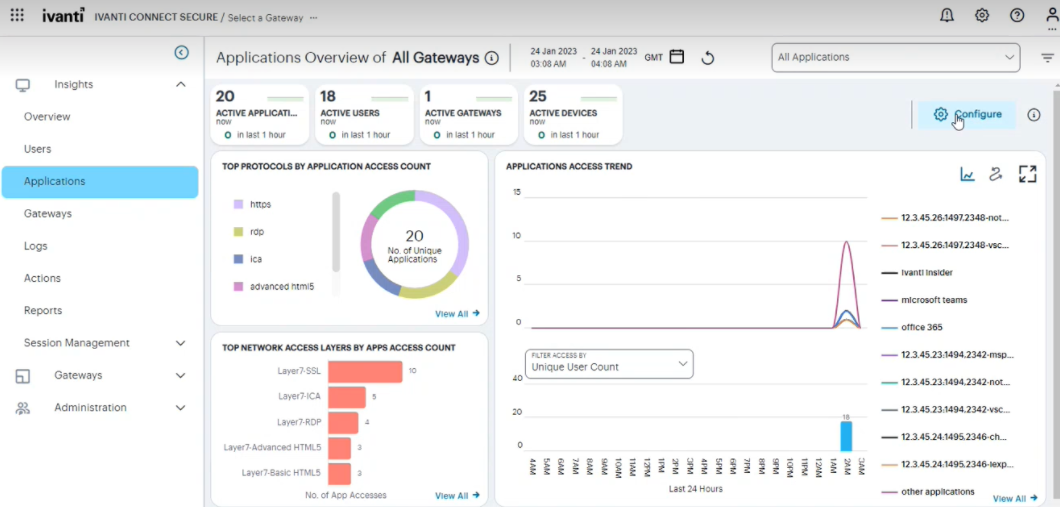
FIGURE 84 Applications page with Configure option (nZTA license enabled)
To configure nZTA policy to the ICS application:
In the ICS applications page, click Configure.
The Configure Applications page is displayed showing a list of accessed applications behind the ICS gateway.
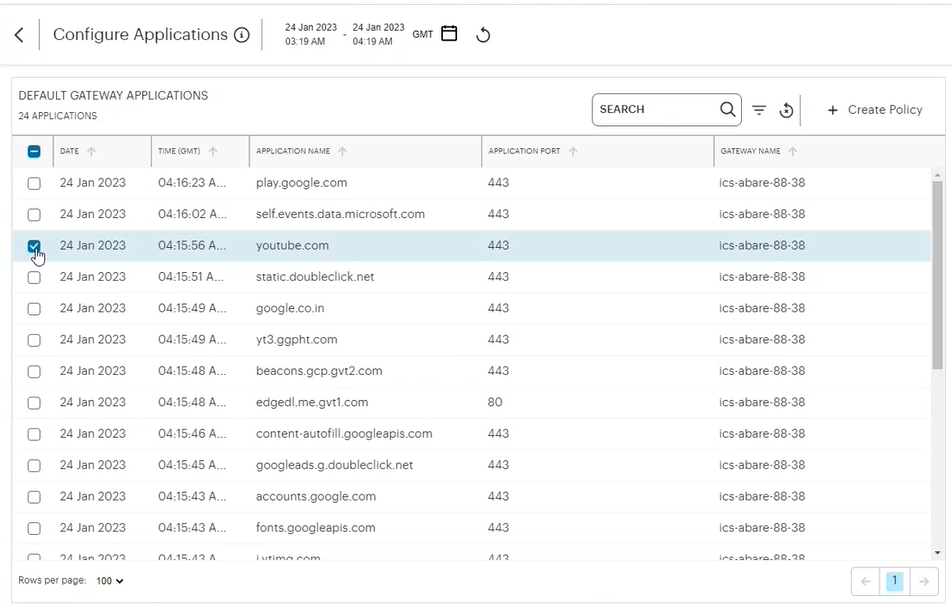
FIGURE 85 Configure ICS applications
In the search box provided, start typing the application name. ICS auto-completes any matching application name.
Select an application from the list and click Create Policy to create a nZTA Policy.
The nZTA Create Secure Access Policy page is displayed. The Application Name, Application Detail and Description fields are pre-filled in the page.
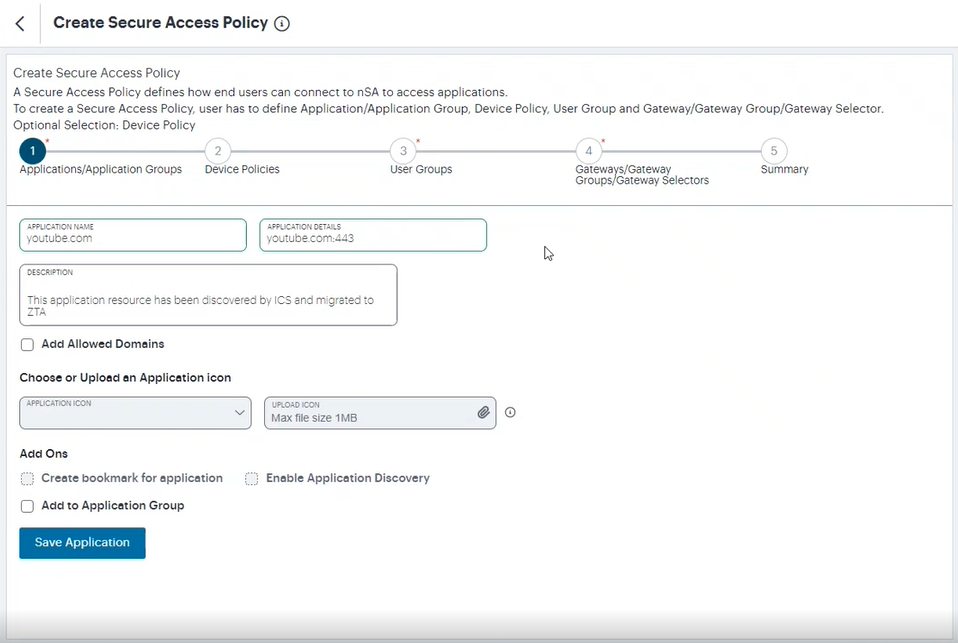
FIGURE 86 Create nZTA policy
Click Save Application and then click Next.
Define Device Policy, User Group and Gateway/Gateway Group/Gateway Selector. For details, see the section Creating a Secure Access Policy.
Reviewing Individual User Activity
This page shows activity relating to a specific user in your Ivanti Connect Secure deployment.
To access the User Overview page:
Log in to the Ivanti Neurons for Secure Access Admin portal as a Tenant Admin, and select Ivanti Connect Secure from the Gateway Switcher. See Logging in to Ivanti Neurons for Secure Access.
The Network Overview page appears by default.
Launch the User Overview page by doing one of the following:
In the Search field on Filter bar, type the username for which you want to see the activities.
In the Summary ribbon, click Active Users. In the Active Users panel displayed, click the username link for which you want to see the activities.
Click the View All link in any of the charts. In the logs table displayed, click the username link for which you want to see the activities.
The User Overview page is displayed.
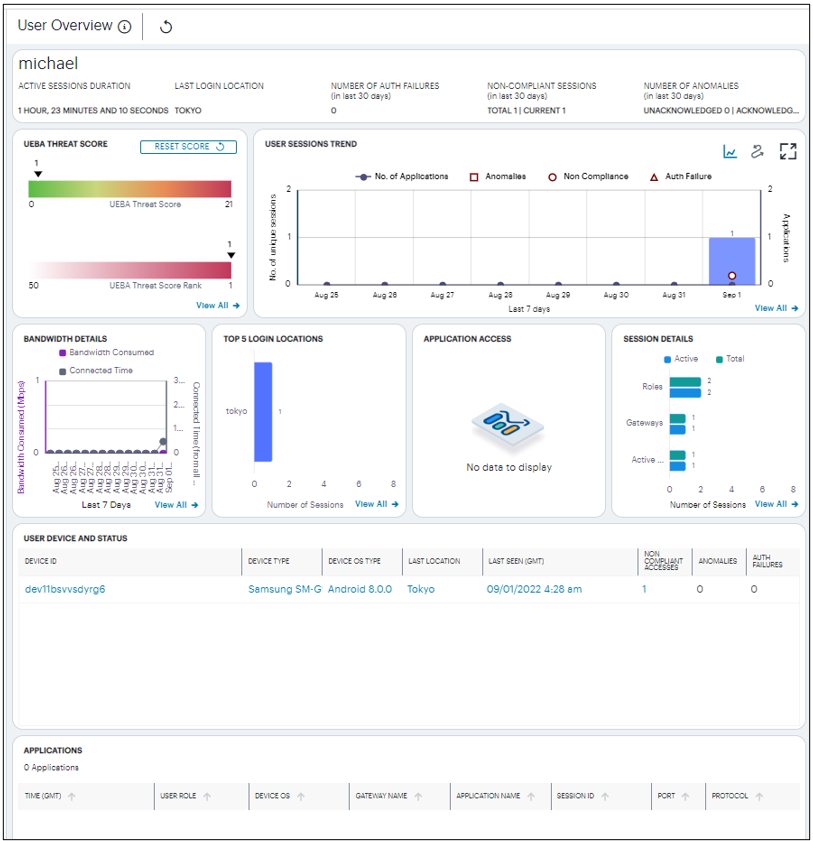
FIGURE 87 Viewing User Activity
The page has the following areas:
The Filter bar
The Summary ribbon
UEBA Threat Score and UEBA Threat Score Rank
User Sessions trend
Activity charts, showing charts for Bandwidth details, Last 5 Login Locations, Application Access and Session Details
Table showing User Device and Status
Each chart on this page includes a View All link. This link provides access to a detail view showing logs for the corresponding chart.
Using the Filter Bar
The top part of the page has the option to manually refresh the data.
Viewing the User Summary Ribbon
The Summary ribbon provides the following metrics:
Active Sessions Duration – All active sessions duration combined of the user, displayed in hours, minutes, and seconds.
Last Login Location – The location from where the user has last logged in.
Number of Auth Failures – The number of authentication failures for this user in the last 30 days.
Number of Non-Compliant Sessions – The number of Non-compliant sessions (full/partial non-compliant) for this user across all gateways in the last 30 days.
Number of Anomalies – The number of anomalies (acknowledged and unacknowledged) detected by Ivanti Connect Secure in the last 30 days.

FIGURE 88 Viewing User Summary Ribbon
Viewing the UEBA Threat Score
The UEBA Threat Score panel contains:
UEBA Threat Score – It is the cumulative value of number of anomalies and number of non-compliant sessions of this user. Click the View All link to see the log details in a table.
UEBA Threat Score Rank – It is the UEBA Threat score position of this user based on the UEBA Threat scores of all the users in the tenant.
Reset Score – As an administrator, you can reset the UEBA Threat score of this user.
Note
A user’s UEBA Threat score is calculated from a combination of geographic anomalies, non-compliance with device policies, and activity deviations.
Viewing the User Session Trend
This section shows the following user activities per day that occurred during the last seven days. You can hover over the trend to view details.
Number of unique Active Sessions
Number of Applications accessed
Number of Anomalies
Number of Non-Compliance sessions
Number of Auth Failures
Viewing the User Activity Charts
This Ivanti Connect Secure provides charts to represent user activity:
Bandwidth Details – shows the Bandwidth Consumed per day and Total Time connected per day by the user for the last seven days.
Last 5 Login Locations – shows the last top five Login Locations accessed by the user in the last 30 days.
Application Access – shows the number of Applications accessed by the user in the active sessions and in the last 30 days based on Bookmark, VDI and HTML5 access.
Session Details – shows the number of Active Sessions and Total number of sessions in the last 30 days based on Role, Gateways and Active sessions
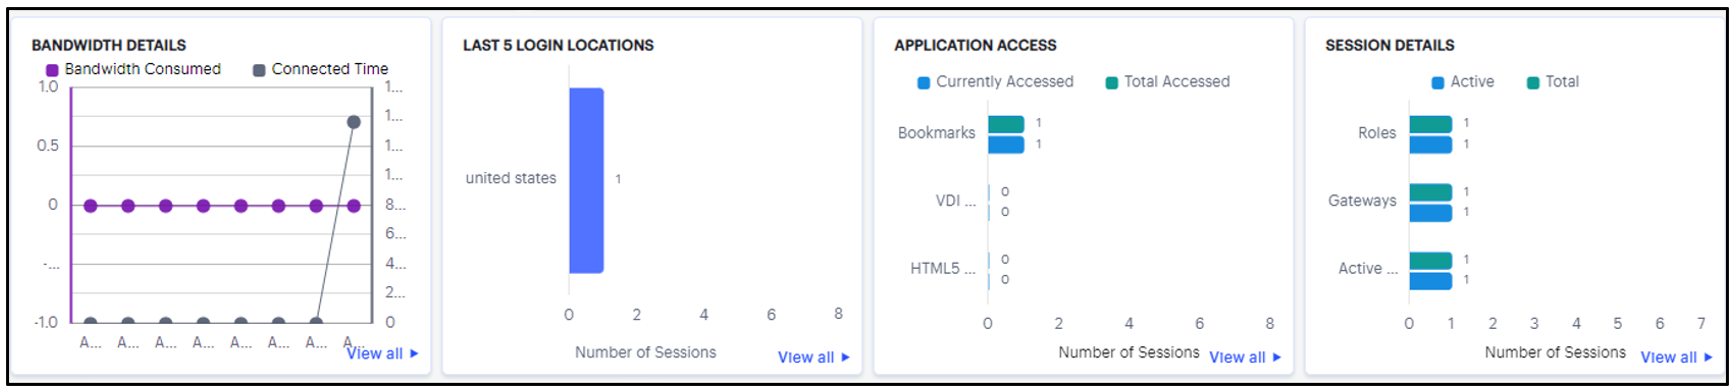
FIGURE 89 Viewing User Activity Charts
Click the View All link that provides access to a detailed view showing logs for the corresponding chart.
Viewing the User Device and Status
This table provides the status of the devices used by the user for connecting to VPN in the last 30 days. Each row in the table includes Device ID and Device Type of a device among other user session details.
Click the link in each column to drill-down for additional details.
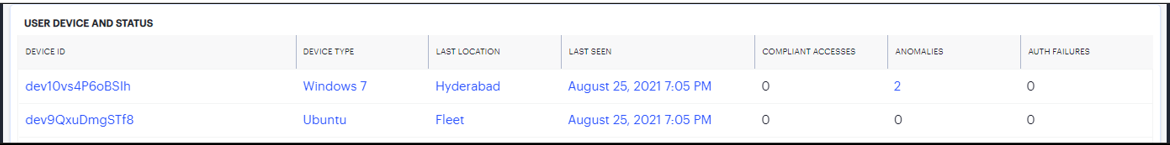
FIGURE 90 Viewing User Device and Status
Reviewing Gateways Status and Versions
The Gateway Overview page gives an overall detail of all the gateways that are registered in the tenant.
To access the Gateway Overview page:
Log in to the Ivanti Neurons for Secure Access Admin portal as a Tenant Admin, and select Ivanti Connect Secure from the Gateway Switcher. See Logging in to Ivanti Neurons for Secure Access.
From the Ivanti Connect Secure menu, click the Insights icon, then select Gateways.
The Gateway Overview page appears.
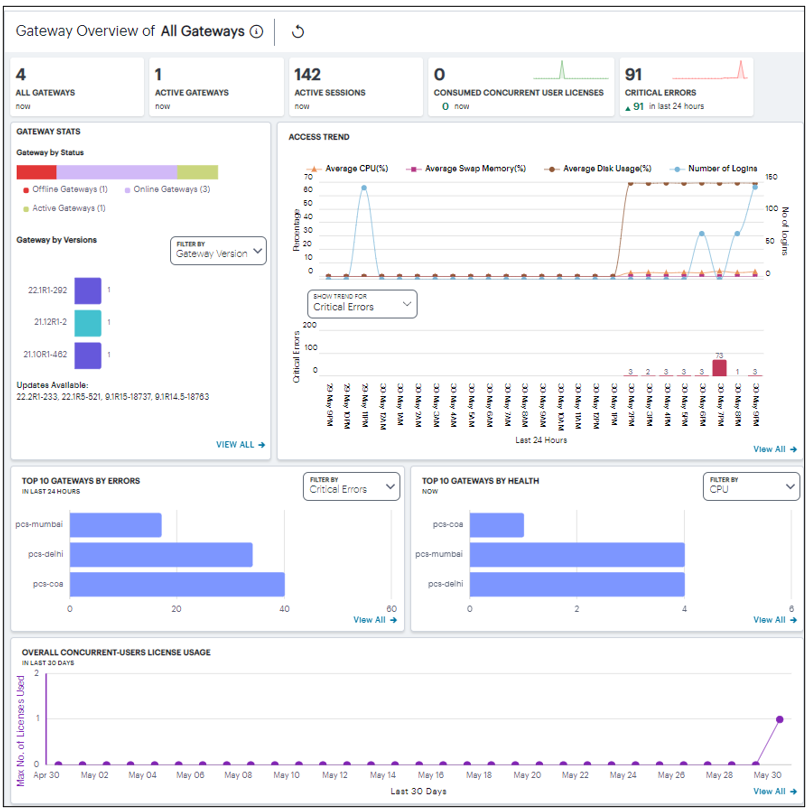
FIGURE 91 Gateway Overview
Understanding the Display
The Gateway Overview page contains the following components:
Summary ribbon
Gateway Status and Versions
Access Trend View
Top 10 Gateways by Errors
Top 10 Gateways by Health
Overall Concurrent Users License Usage
Use the Filter bar, located on the top-right-corner of the page, that allows the selection of any individual Ivanti Connect Secure Gateway.
Each chart on this page includes a View All link. This link provides access to a detail view showing logs for the corresponding chart.
Viewing the Gateways Summary Ribbon
The Gateway Overview Summary panel gives the following details:
All Gateways: Shows the total number of Ivanti Connect Secure Gateways that are registered with the tenant.
Active Gateways: The total number of active gateways within the tenant.
Active Sessions: The total number of active sessions across all the connected gateways within the tenant.
Consumed Concurrent User Licenses: The total number of concurrent user licenses consumed across all the gateways.
Critical Errors: The total number of critical errors in the last 24 hours across all the gateways. The trend shows the critical error occurrence in the last 24 hours. It also shows the number of errors increased or decreased in the last 24 hours.
Viewing the Gateways Status and Versions
The Gateways by status chart shows the distribution of gateways by their status:
Offline Gateways: All gateways that are registered with the tenant, but not connected.
Online Gateways: All gateways that are registered with the tenant and connected but are not running any sessions.
Active Gateways: All gateways that have at least one active session.
The Gateway by versions chart shows the distribution of latest 10 gateway versions across all the gateways within the tenant. The Gateways by ESAP version chart shows the distribution of latest 10 ESAP versions across all the gateways within the tenant.
To view a detailed list of events that contributed to the totals, click View All.
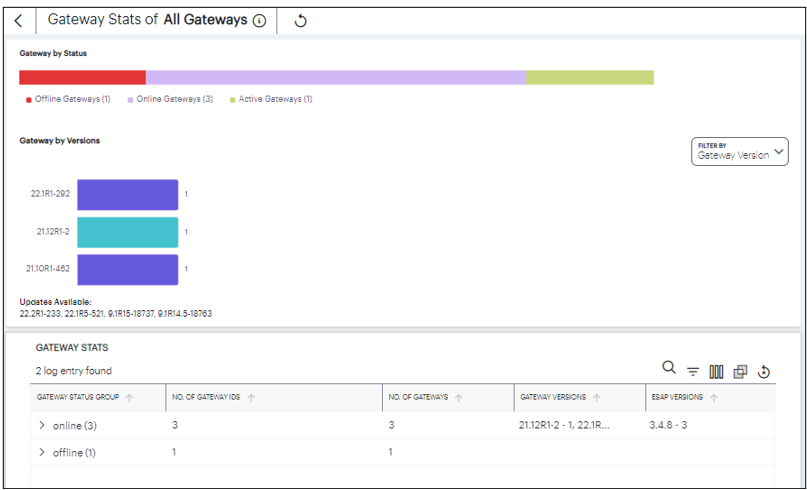
FIGURE 92 Gateway Status and Versions
Viewing the Gateways Access Trend
Ivanti Connect Secure uses the Gateways Access Trend section to show:
the hourly distribution of the number of logins, average CPU usage, average memory usage, average disk usage, average network throughput across all the gateways during the last 24 hours.
the hourly distribution of critical errors across all the gateways during the last 24 hours.
You can check the trend for Critical Errors and Throughput (MB).
To view a detailed list of events that contributed to the totals, click View All.
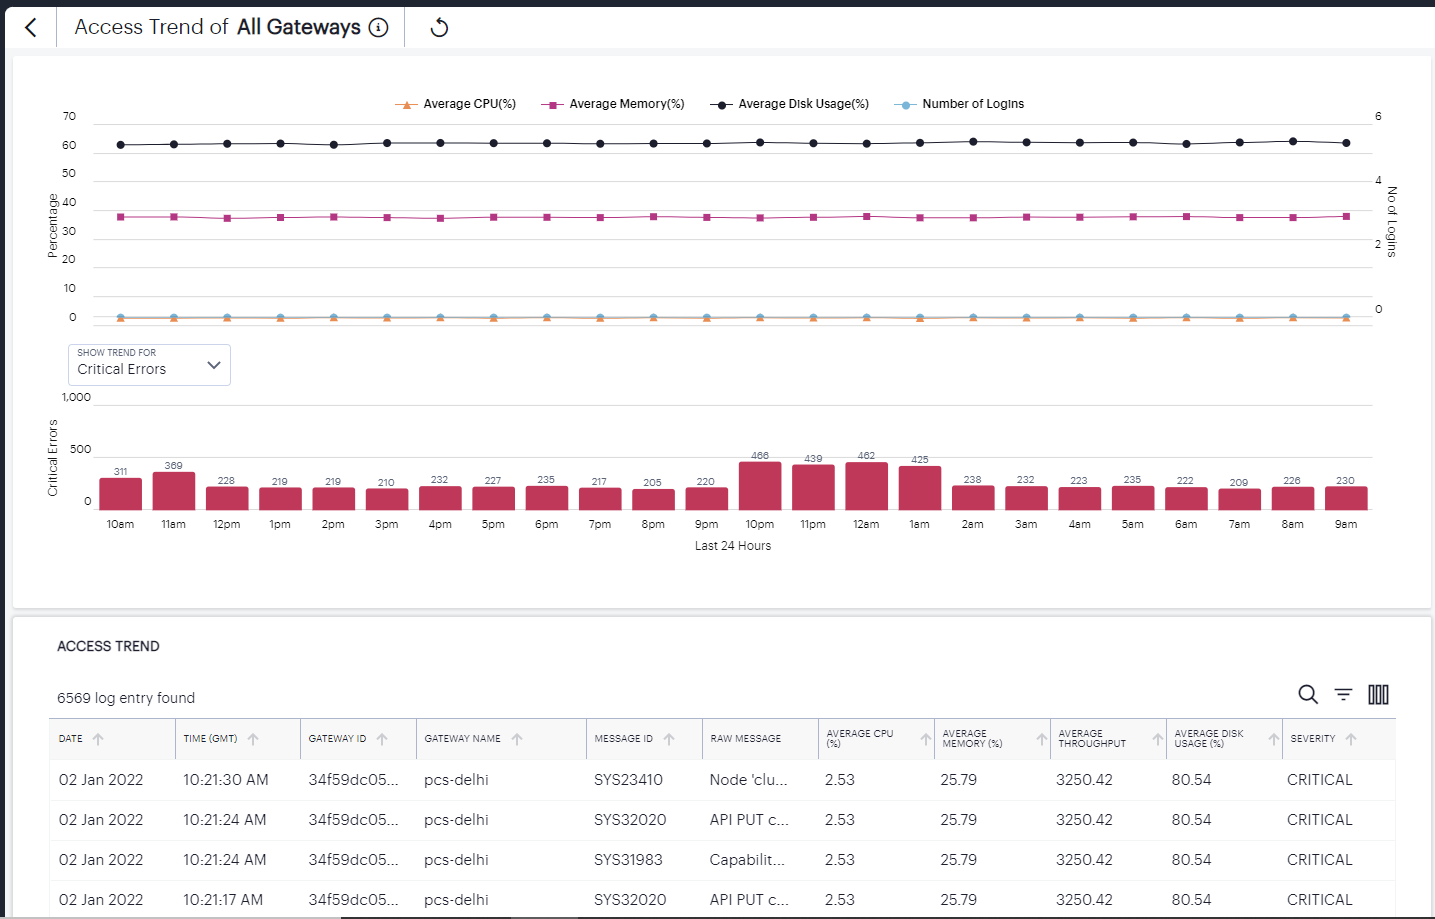
FIGURE 93 Gateways Access Trend
Viewing the Top Gateway Activity Charts
Ivanti Connect Secure provides charts to show breakdown of Top 10 Gateways by Errors and Top 10 Gateways by Health.
The Gateways by Errors chart provides the total number of Critical Errors or Integrity Check Violations across top 10 gateways over the last 24 hours. Use the Filter drop-down to select the option from the list.
To view a detailed list of events that contributed to the totals, click View All.
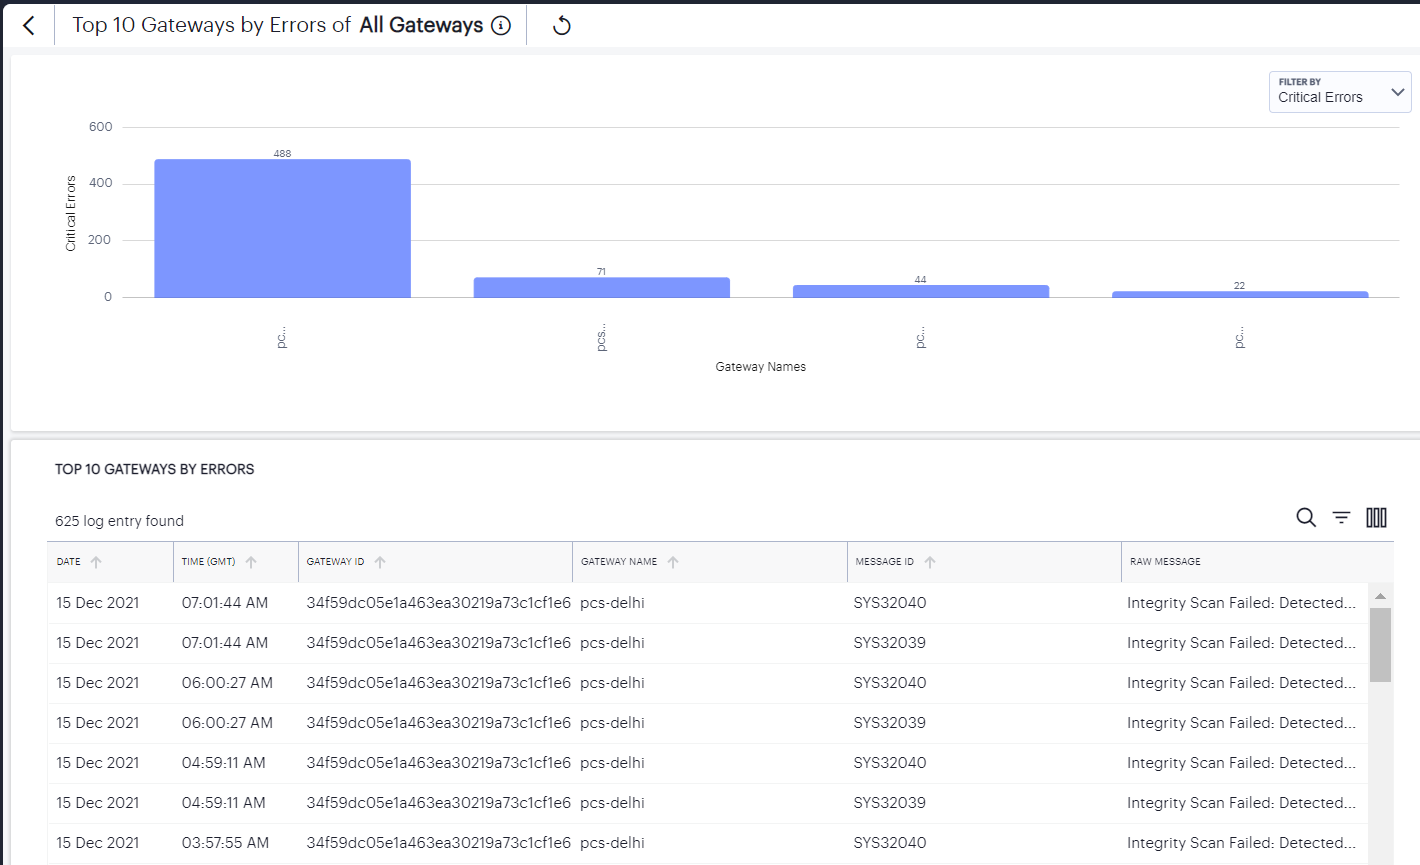
FIGURE 94 Top Ten Gateways by Errors
The Gateways by Health chart shows the top 10 gateways that have high CPU usage, Memory usage, Disk usage, or Network throughput. Use the Filter drop-down to select the option from the list.
To view a detailed list of events that contributed to the totals, click View All.
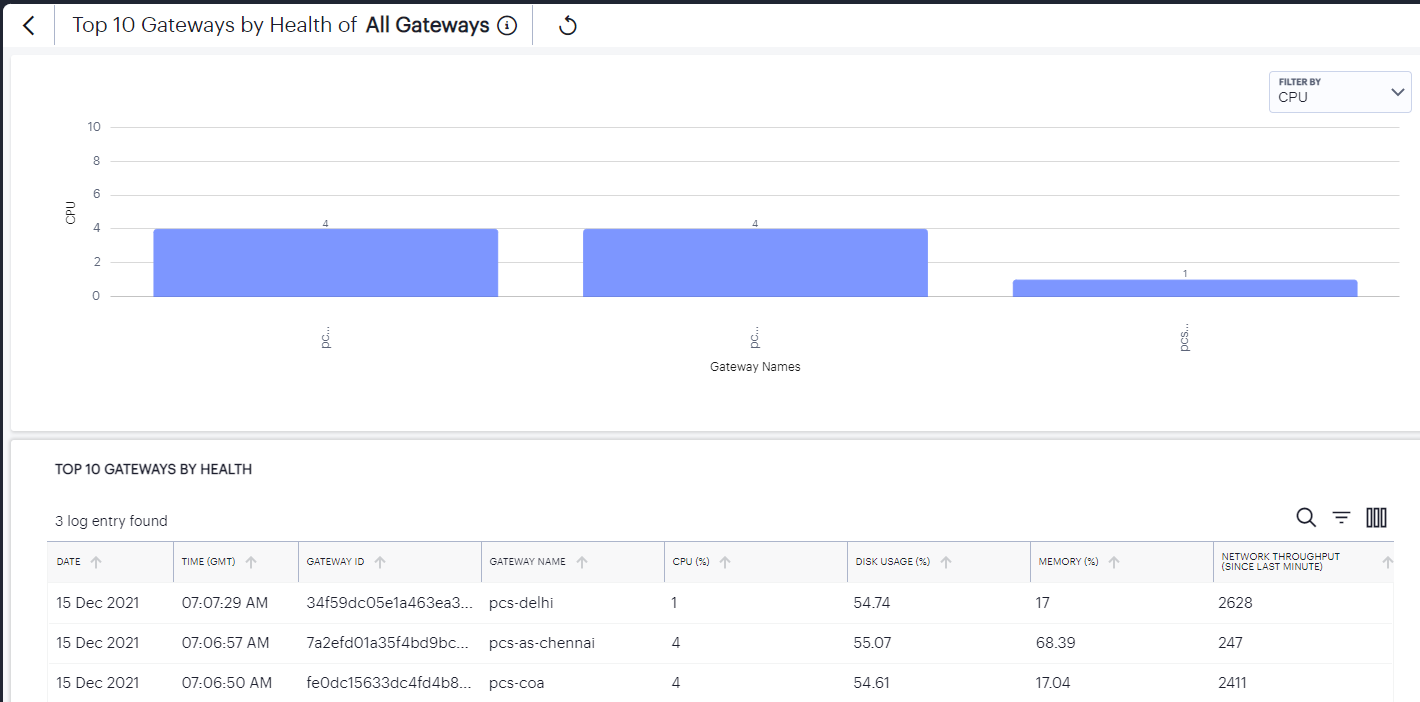
FIGURE 95 Top Ten Gateways by Health
The Overall Concurrent Users License Usage chart provides the maximum licenses used on a daily basis across all the gateways over the last 30 days.
To view a detailed list of events that contributed to the totals, click View All.
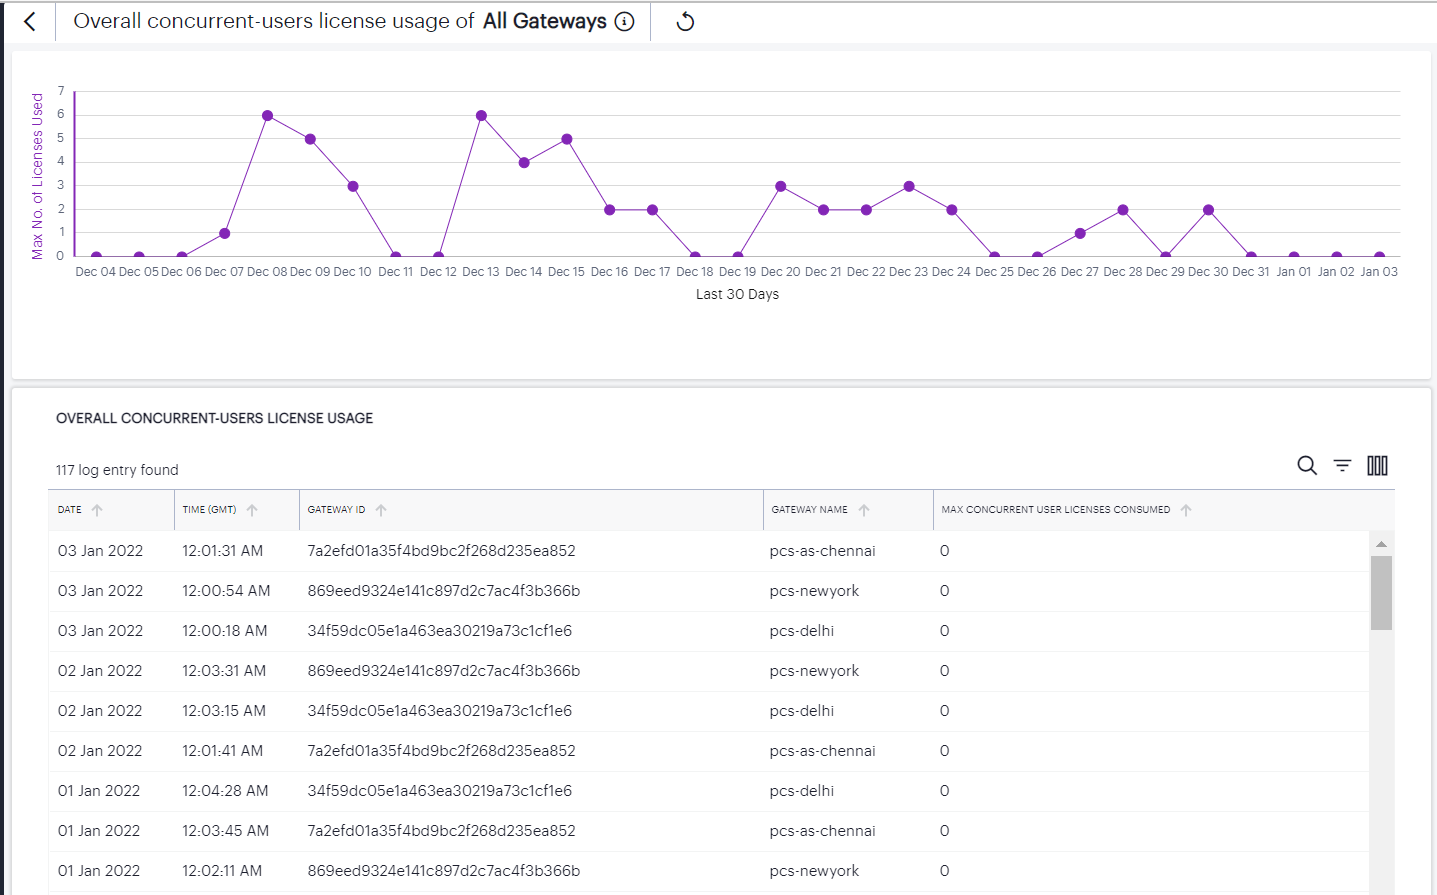
FIGURE 96 Overall Concurrent Users License Usage
Checking the Logs
The Ivanti Connect Secure Logs page displays audit and activity events observed by your Ivanti Connect Secure access infrastructure. These events are reported to the Ivanti Neurons for Secure Access by your Gateways and Authentication, Authorization and Accounting (AAA) service.
To view the Logs page:
Log in to the Ivanti Neurons for Secure Access Admin portal as a Tenant Admin, and select Ivanti Connect Secure from the Gateway Switcher. See Logging in to Ivanti Neurons for Secure Access.
From the Ivanti Connect Secure menu, click the Insights icon, then select Logs.
The Logs page appears.
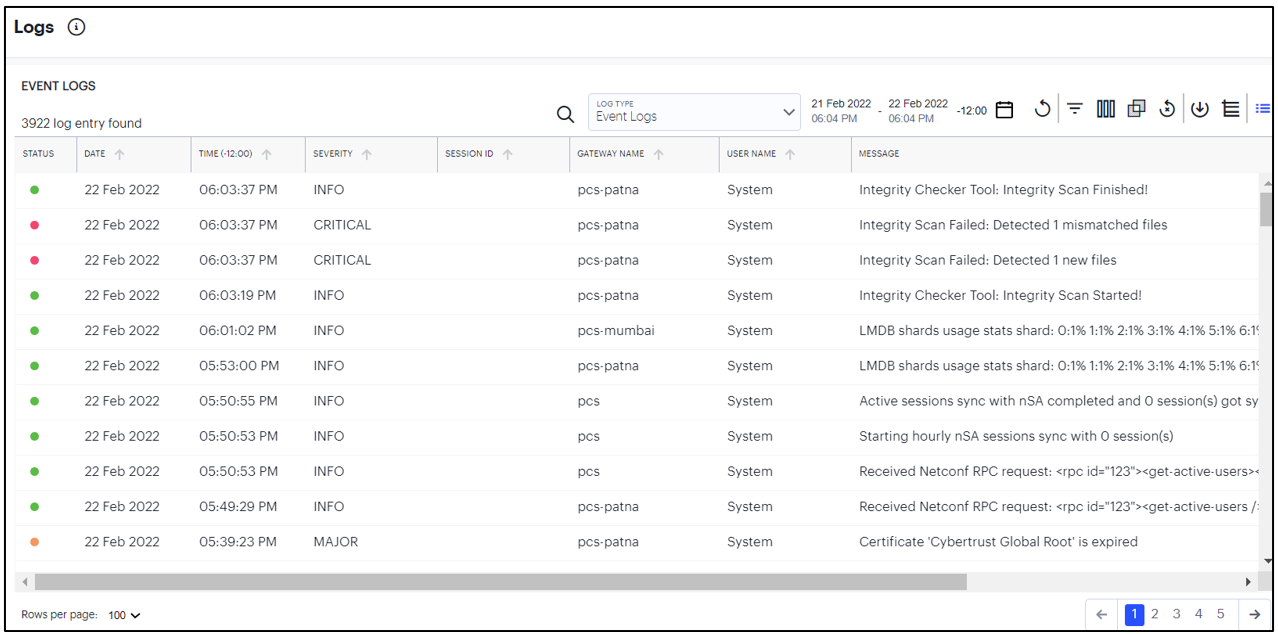
FIGURE 97 Viewing the Logs
This page comprises the following sections:
Log selection and filtering controls, see Setting Log Criteria and Filtering the Output.
The log record display, see Viewing Log Records.
Note
Ivanti Connect Secure additionally provides a separate log records page pertaining to activity for specific Gateways.
Setting a Log Time Period
Use the time period selectors at the top of the page to set a time period or time range for your log results.
To switch between Time Period and Time Range. use the following icon:
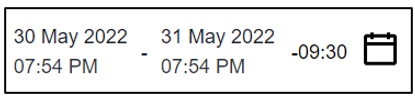
FIGURE 98 A choice of time period or time range
The adjacent time selection boxes update according to your choice. For Time Period, set the time period you want to view. Choose from:
Last 60 minutes
Last 24 hours (default)
Last 7 days
Last 1 month
For Time Range, set a specific Date and Time for both the start and end of your time range.
Setting Log Criteria and Filtering the Output
To set the criteria you want to use for viewing log data, use the controls above the main log display. This section also contains functions to highlight search terms, apply filters, and schedule log export jobs.
Select the primary log type you want to display by using the Log Type drop-down list:
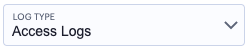
FIGURE 99 Selecting a log type
Choose from:
Access Logs
Admin Logs
Event Logs
Then, use the icons adjacent to the log selector to further control your log selection. Choose from the following:
To search for a term in the displayed logs, click the following icon:

FIGURE 100 Search term highlighting
Ivanti Connect Secure highlights all matches is the log display.
Logs are refreshed automatically by changing the criteria. To manually refresh the log display, click the following icon:

FIGURE 101 Page refresh
To change the fields displayed for each log line, click the following icon:

FIGURE 102 Show or hide log fields
In the field selector, click a field name to toggle between show or hide. A tick icon indicates a displayed field. After you are finished, click the context menu icon to close the selector. See Viewing Log Records.
To trigger the advanced filter selection, use the following icon:
FIGURE 103 Advanced Filtering
To learn more, see Filtering the Logs.
To group the logs based on the fields, use the Group by option and select the field type to view the table information in groups.
FIGURE 104 Group by icon
Click > to view the logs in that group.
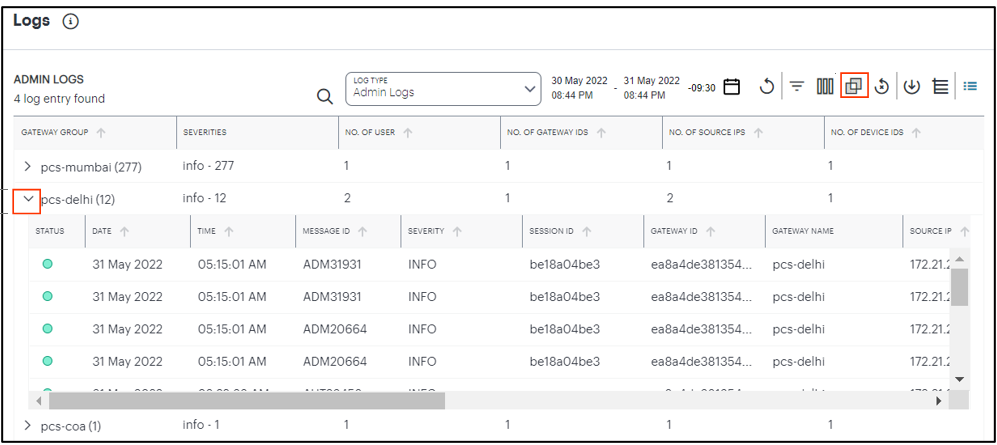
FIGURE 105 Group by logs
To export the displayed log as a CSV or JSON text file, or to set up a new scheduled log export job, click the following icon:

FIGURE 106 Export filtered logs
To learn more about log export jobs, see Exporting Logs.
To view the status of currently-scheduled log export jobs, click the following icon:

FIGURE 107 View scheduled log export jobs
To learn more about log export jobs, see Exporting Logs.
To change the view density, click the following icon:

FIGURE 108 Switching between default and dense log record views
Viewing Log Records
The main part of the page shows the log records that match your selected criteria. The number of matching log records is displayed at the top-left.
Each log line includes the following fields:
A status indicator showing the level of severity associated with each log event. Use the following table for a guide to the meaning of each indicator color:
Severity
Status Color
INFO
Green
MINOR
Amber
MAJOR
Amber
CRITICAL
Red
The date and time of the event.
The message ID that identifies this type of event.
The severity of the event in words.
The session ID that was the source of the event, where applicable.
The ID of the Ivanti Connect Secure Gateway that reported the event, where applicable.
The name of the Ivanti Connect Secure Gateway that reported the event, where applicable.
The IP address identified as the source of the event.
The user name associated with the event, where applicable.
The ID of the device associated with the event, where applicable.
The message (description) of the event.
Use the page controls at the bottom to select the number of log records/rows per page:
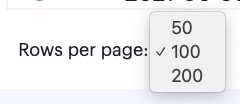
FIGURE 109 Setting the number of log rows per page
Choose from:
50
100 (default)
200
To cycle through the log pages, use the page controls at the bottom-right.
Where a single log message is too long for the display, use your pointing device to scroll the optional fields display to the left or right.
Furthermore, to view a single log entry in a dedicated panel, click the log message text to activate the info-panel view:
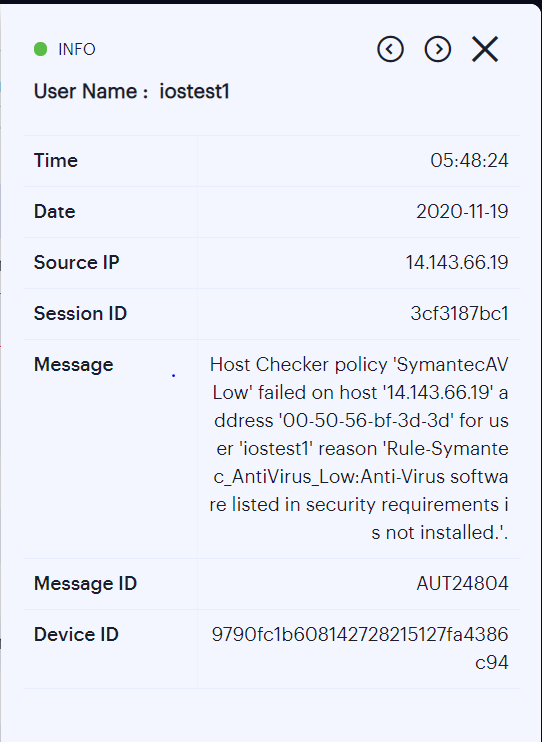
FIGURE 110 Viewing a single log entry in the info-panel
Note
In the info-panel, use the Previous and Next icons to cycle through each log entry in turn.
Filtering the Logs
The Logs page provides an advanced field filter through which you can narrow down the displayed log entries to a sub-set that matches the filters you apply.
To add a filter, click the following icon:
FIGURE 111 Activating the advanced filter
Next, use the pop-up dialog to add one or more new field filters.
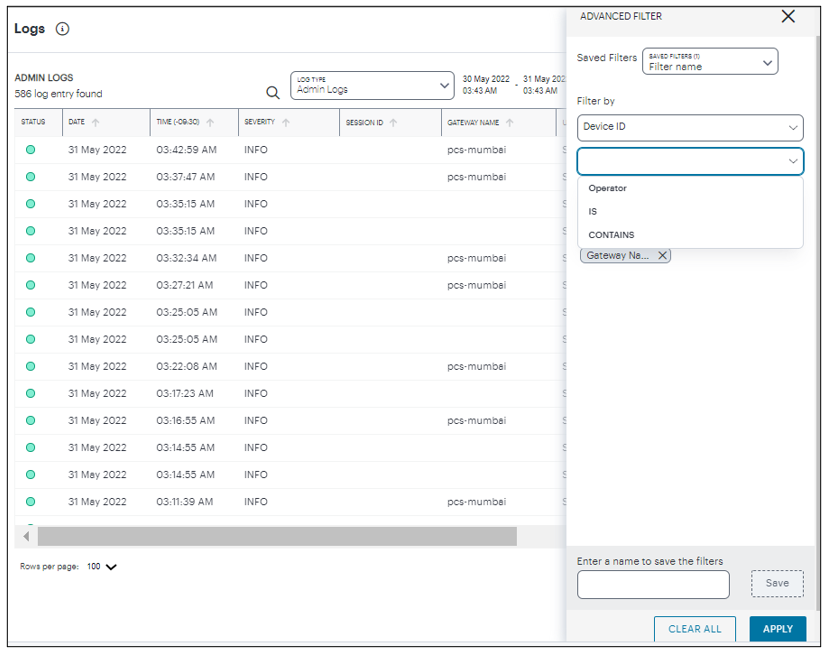
FIGURE 112 Adding a new log filter
Use the Selector drop-down list to choose the field you want to filter on, add an Operator type, and then enter the Value you want to apply.
For the operator, choose from:
IS: The selected field matches exactly the value you specify.
CONTAINS: The selected field contains as a sub-string the value you specify.
Click the plus symbol to add your filter, then repeat the process to add any further filters you want to apply.
To apply your filters to the log data, click APPLY.
Your filters remain in place through data refreshes and are displayed at the bottom of the screen. To remove a filter, click the corresponding X icon.
In addition, Ivanti Connect Secure enables you to store advanced filters for future use. After you have applied filter criteria, enter a filter name into the box provided and click Save.
To load a previously-saved filter, select your filter from the Saved Filters drop-down list and click Apply.
To delete one or more previously-saved filters, select the filters from the Saved Filters drop-down list and click Delete.
Exporting Logs
Ivanti Connect Secure provides the ability to export the currently-displayed log as a Comma-Separated Value (CSV) or JavaScript Object Notation (JSON) text file. You can download the log immediately or set up a scheduled job to activate or repeat the export action at a defined time and interval of your choosing.
To access the Export Logs page:
Log in to the Ivanti Neurons for Secure Access Admin portal as a Tenant Admin, and select Ivanti Connect Secure from the Gateway Switcher. See Logging in to Ivanti Neurons for Secure Access.
From the Ivanti Connect Secure menu, click the Insights icon, then select Logs.
The Logs page appears.
Select the log type you want to display in the Log Type drop-down list. Choose from:
Access Logs
Admin Logs
Event Logs
Click the cloud icon at the top of the page:
FIGURE 113 Accessing the Export Logs Settings page
The Export Logs page appears:
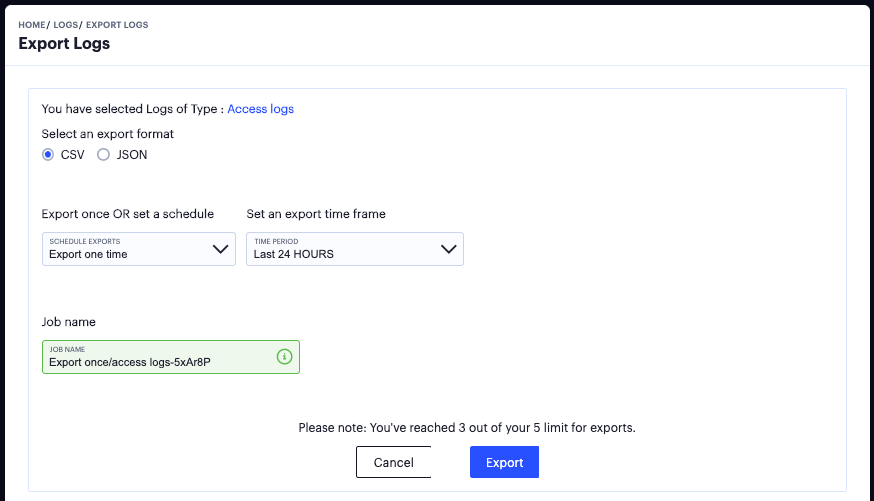
FIGURE 114 The Export Logs settings page
Use the Export Logs settings page to configure an export operation, either to execute immediately as a one-off job, or as a scheduled job.
Configure the following settings:
Select either CSV or JSON as the output format.
Select the frequency of the export operation. Choose from:
Export one time: Perform the log export now as a single job.
Daily data export: Create a daily export job executed once per day from the selected start date, up to and including the stop date (if defined).
Weekly data export: Create a weekly export job executed once per week on the selected start day, up to and including the stop date (if defined).
Monthly data export: Create a monthly export job executed once per month on the selected start day, up to and including the stop date (if defined).
If a stop date is specified, this is the date the schedule ceases. In the case of weekly or monthly jobs, if this date falls before the expected run date for that period, the job is terminated without running. For example, in a weekly run scheduled to execute every Thursday, if the stop date is set as a Tuesday, the final run of the job would be the previous Thursday.
Note
A daily data export job continues to run for one extra day beyond the selected end date in order to process the logs for the final scheduled day.
Note
For daily/weekly/monthly frequency export jobs, Ivanti Connect Secure allows for a maximum of 5 runs per scheduled export job. That is, each schedule runs a maximum of 5 times. On the sixth run, the first run is deleted (together with the log file), and so on.
Set an export time frame. For one-time exports, choose from:
Last 60 minutes
Last 24 hours
Last 7 days
Last 1 month
Set a date range (30d max): This option presents a configurable start and end date.
For daily, weekly, and monthly exports, this option switches to show start and end date parameters. You do not need to specify an end date; in this case, the job remains active until deleted.
Enter a Job name for the export operation. Ivanti Connect Secure suggests an appropriate name; use this, or type your own.
To execute the defined job, click Export.
To view all scheduled export logs jobs, and to download the log files created by each job, see Viewing Scheduled Log Export Jobs and Downloading Log Files.
Note
Ivanti Connect Secure allows for a maximum of 5 defined export jobs. Each job that you add reduces the total, as displayed at the bottom of the page. This is a separate limit to the maximum number of job runs described earlier.
Viewing Scheduled Log Export Jobs and Downloading Log Files
To view the status of your current log export jobs:
Log in to the Ivanti Neurons for Secure Access Admin portal as a Tenant Admin, and select Ivanti Connect Secure from the Gateway Switcher. See Logging in to Ivanti Neurons for Secure Access.
From the Ivanti Connect Secure menu, click the Insights icon, then select Logs.
The Logs page appears.
Click the list icon at the top of the page:
FIGURE 115 Accessing the Job Status page
The Job Status page appears:
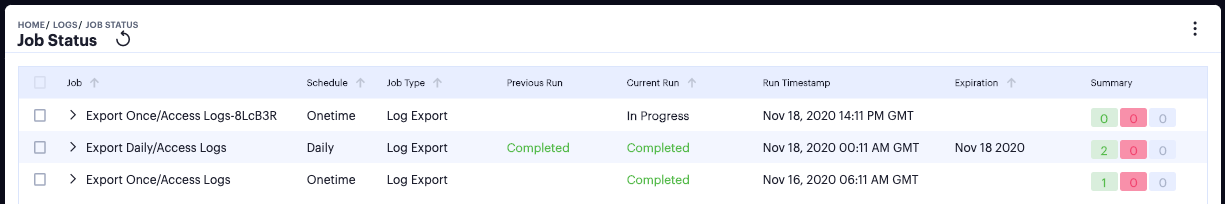
FIGURE 116 The Job Status page
Use the Job Status page to:
View the status and progress of currently scheduled log export jobs.
Download log files for completed job runs.
For each job on the Job Status page, you can view the configured details of the export operation along with status indicators for progress of the previous and outstanding job runs.
Note
A job run refers to a single run of a scheduled job. For example, in a weekly data export job, a job run refers to the export operation scheduled or completed for one specific week within the start and end dates. Thus, a scheduled log export job is comprised of one or more job runs.
The Summary column provides totals of successful job runs, unsuccessful/failed job runs, and inactive job runs.
Click any of the fields in a single job row to display an info-panel at the side showing more details about the scheduled job:
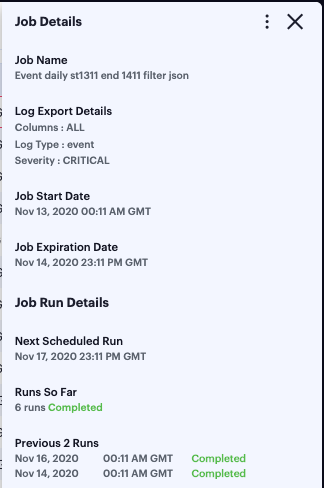
FIGURE 117 The Job Details info-panel
To access the log files and view more information about each individual job run, click the down-arrow adjacent to the Job name:
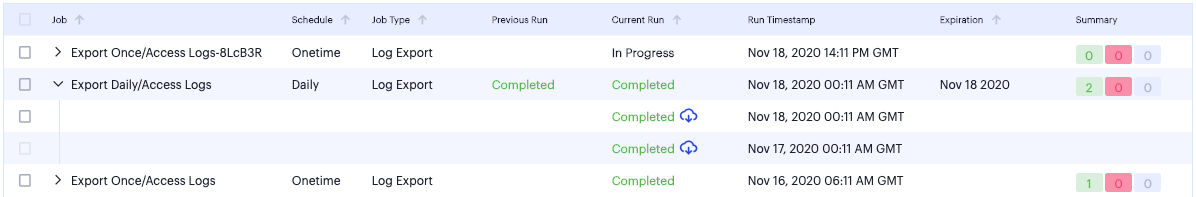
FIGURE 118 Showing all job runs for a scheduled export job.
Note
For daily/weekly/monthly frequency export jobs, Ivanti Connect Secure allows for a maximum of 5 runs per scheduled export job. That is, each schedule runs a maximum of 5 times. On the sixth run, the first run is deleted (together with the log file), and so on.
As with a scheduled job, click on any of the fields in the job run row to display an info-panel at the side showing more details about the job run:
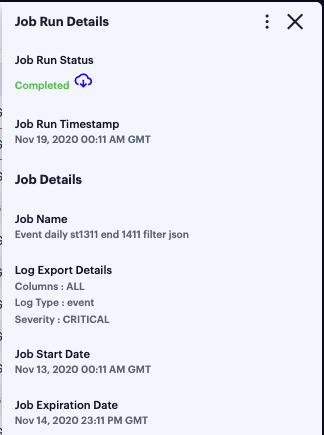
FIGURE 119 The Job Run Details info-panel
To download the log file generated by the job run, click the cloud icon for a completed job run:
FIGURE 120 Downloading a log file
To remove a scheduled log export job, or any of the completed job runs within the job, tick the checkbox adjacent to the job/job run and then access the context menu at the top of the page:
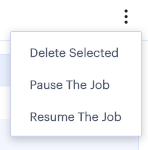
FIGURE 121 The Job Status menu
Select from the following options:
Delete Selected: Remove all jobs or job runs that have been selected.
Pause the Job: Instruct the outstanding job runs in the schedule to become inactive. The schedule continues chronologically, but no further log export operations are completed while in this state.
Resume the Job: Resume the schedule starting at the next scheduled job run.
Note
If you choose to delete a complete job, all job runs and log download files are removed permanently.
Associating Geographical locations to IP Addresses
Ivanti Connect Secure provides the mapping of Gateway geographic location to IP address.
Before you start, make sure that you have the following information:
The public IP address/range for the Gateway. This is the IP address at which clients can externally reach the Gateway.
The Gateway geographic location information such as country, state/province and city.
To add a new location:
Log in to the Ivanti Neurons for Secure Access Admin portal as a Tenant Admin, and select Ivanti Connect Secure from the Gateway Switcher. See Logging in to Ivanti Neurons for Secure Access.
From the Ivanti Connect Secure menu, click the Administration icon, then select Custom Geo IP.
The Custom Geo IP page appears. This page lists all defined geographical associations to IP addresses.
Click the + icon at the top of the page:
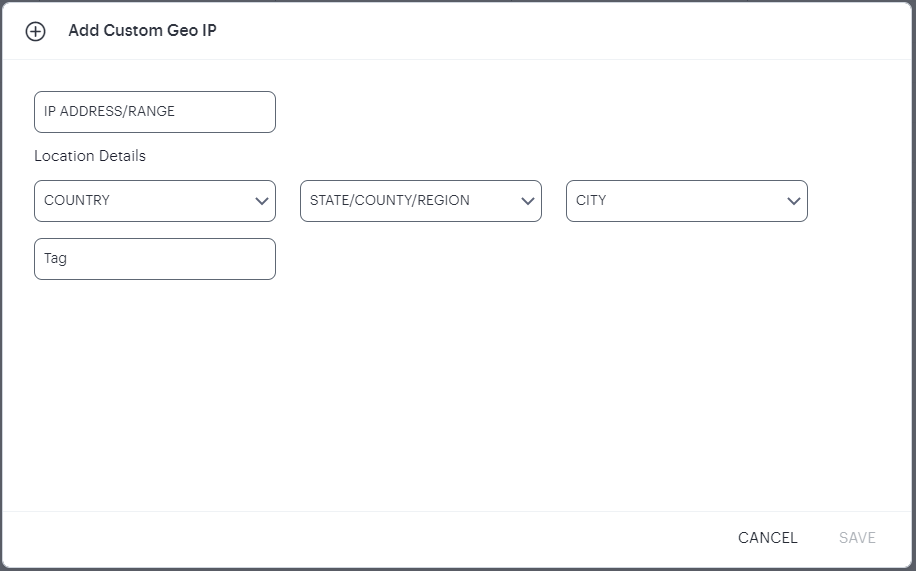
FIGURE 122 The Custom Geo IP
Enter the IP Address/range.
Select the Country.
Select the State/Province.
Select the City.
Enter a Tag for this IP Address/range.
Click Save.
Configuring Actionable Insights
The Actionable Insights function enables the tenant admin to create a policy/action to terminate all the existing sessions, with applicable rule, of a user when the UEBA threat score goes beyond the permissible limit.
To configure actionable insights:
Log in to the Ivanti Neurons for Secure Access Admin portal as a Tenant Admin, and select Ivanti Connect Secure from the Gateway Switcher. See Logging in to Ivanti Neurons for Secure Access.
From the Ivanti Connect Secure menu, click the Insights icon, then select Actions.
The Actionable Insights page is displayed.
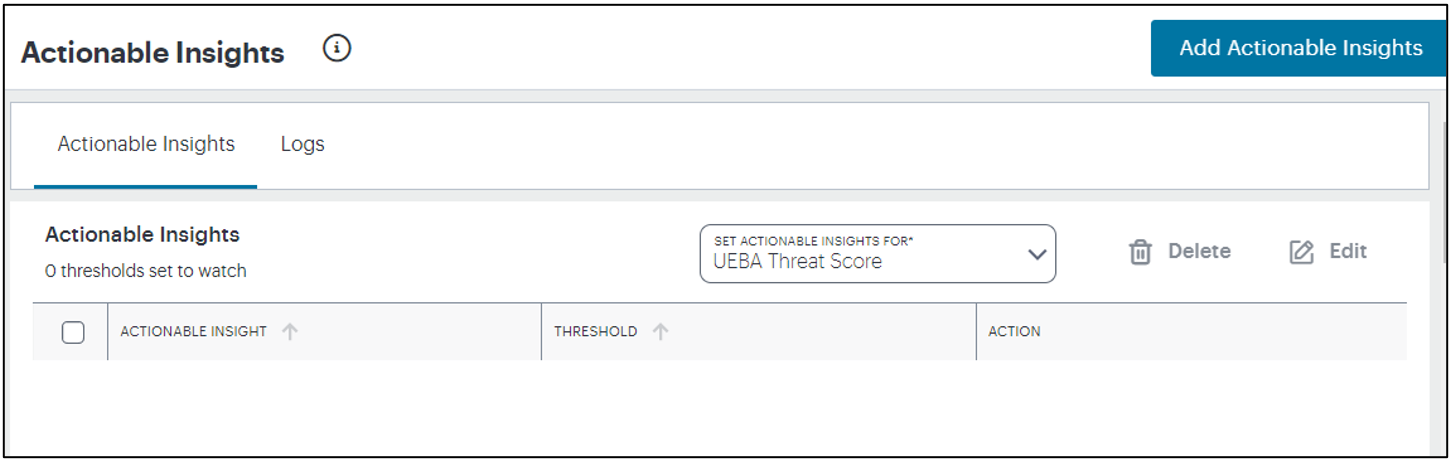
FIGURE 123 The Actionable Insights page
From the Set Actionable Insights for drop-down list, select UEBA Threat Score.
Click Add Actionable Insights.
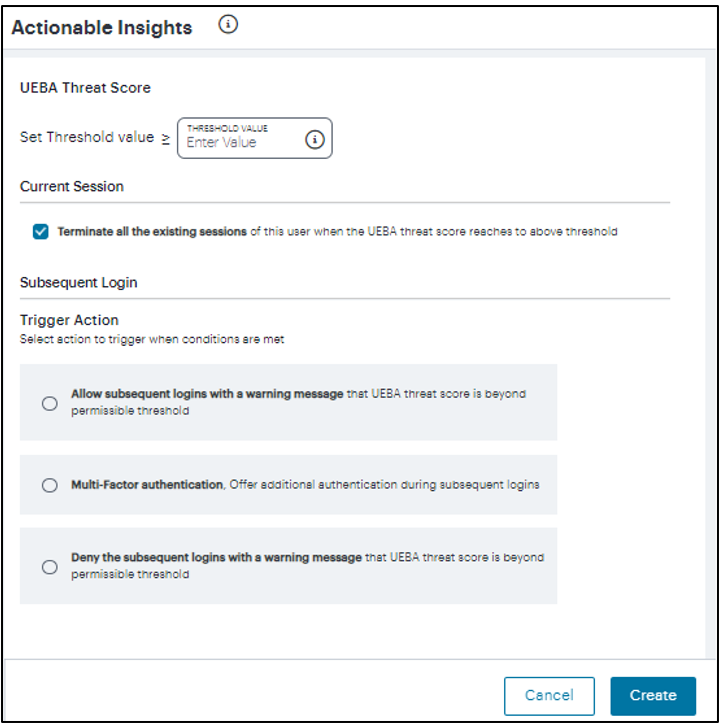
FIGURE 124 Set UEBA Threat Score Threshold
Enter a Threshold Value.
In the Current Session section, select the Terminate all the existing sessions of this user when the UEBA threat score reaches the threshold value option. This is selected by default.
From the Subsequent Login section, select one of the following actions to trigger when conditions are met:
Note
The newly added trigger actions will be supported with the ISAC Client version 22.3R1. For more details, refer KB: https://kb.pulsesecure.net/articles/Pulse_Secure_Article/KB45603.
Allow subsequent logins with a warning message
Offer Multi-factor Authentication during the subsequent logins
Deny subsequent logins with a warning message
Note
A maximum of three thresholds can be created using the subsequent login conditions.
Click Create. A table showing the metric name, threshold value that is set, and the action to trigger when the condition is met, is shown in the Actionable Insights page.
A confirmation message for the successful creation of the action is displayed. Click Close to close the message box.
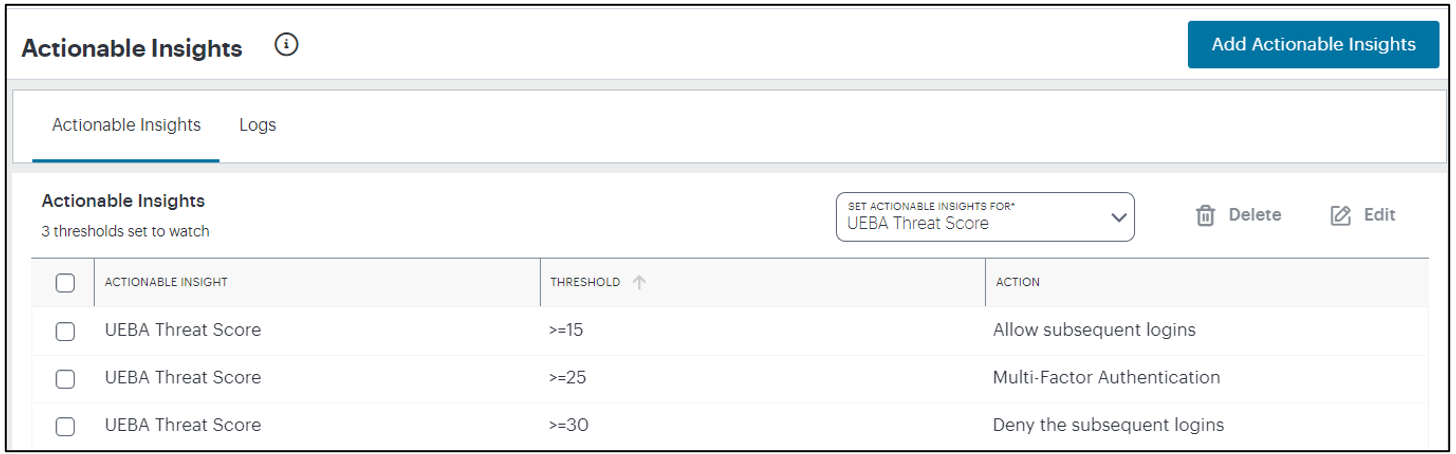
FIGURE 125 The Actionable Insights page
To modify an action, select the check box corresponding to the action from the list, click the Edit icon, make the changes and then click Update.
To change the sequence of the rule, drag up or down the rule.
To remove one or more actions, select the check box(es) corresponding to the action from the list, and click Delete. Click Yes, Delete to confirm.
When a user session is terminated due to reaching the threshold UEBA Threat score, the following admin log message is generated in nSA: “User <username> session <session id> has been terminated due to UEBA Threat score based Actionable Insights configuration”. Select the Logs tab to view the list of log messages.
Generating Reports
The Reports function provides the ability to generate reports from the pre-defined templates or from the custom report. You may choose any of the pre-defined templates from User Activity Summary report, Application Access report, User Risk report or User Session Report. It also provides options to generate reports in PDF, JSON or CSV formats.
Accessing the Reports Page
To access the Reports page:
Log in to the Ivanti Neurons for Secure Access Admin portal as a Tenant Admin, and select Ivanti Connect Secure from the Gateway Switcher. See Logging in to Ivanti Neurons for Secure Access.
From the Ivanti Connect Secure menu, click the Insights icon, then select Reports.
The Reports page is displayed.
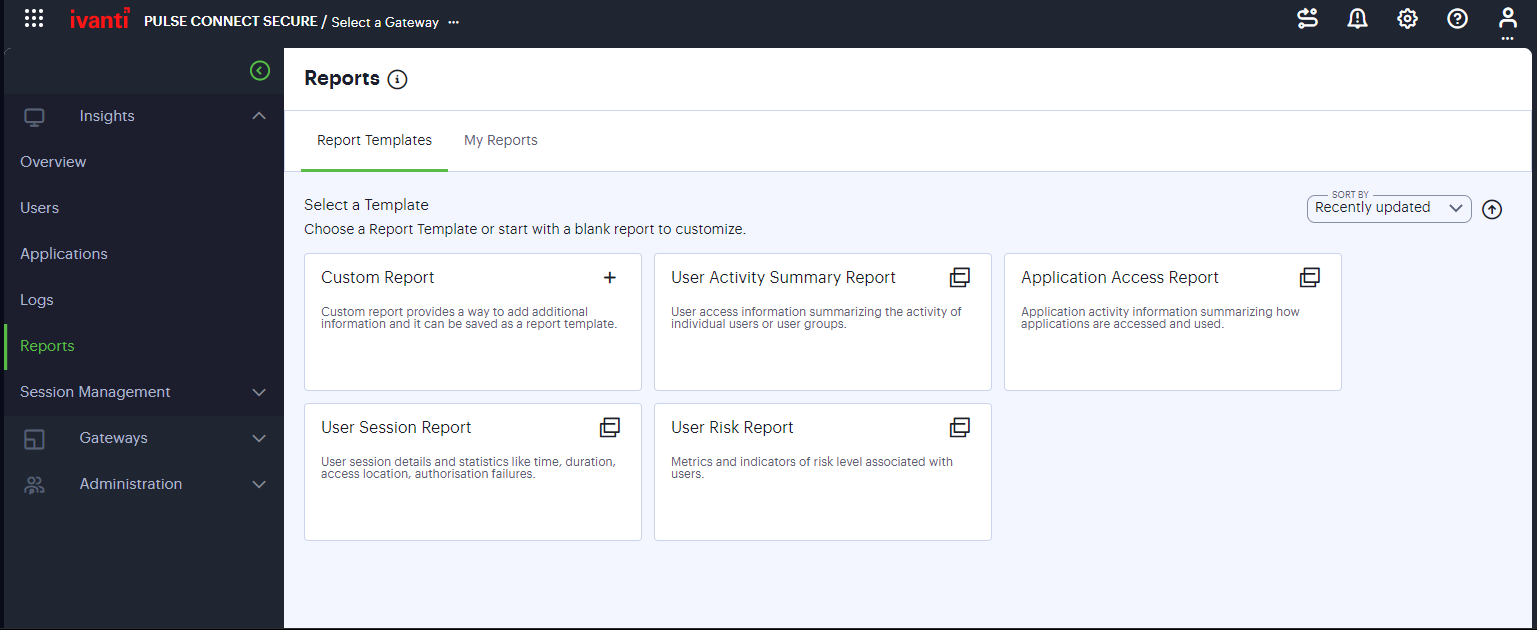
FIGURE 126 The Reports page
The Reports page provides the following tabs:
Report Templates – You can use the Custom Report option or the pre-defined report templates, and go through the wizard to configure and schedule the required report.
My Reports – You can view a list of generated reports for all users of this tenant.
Click the report name link to view the summary of the configured details.
Click the download icon located next to the report to view report in the specified format (PDF, JSON, or CSV)
Configuring a Report
For scheduling a report, you can select one of the pre-defined report templates if that meets your requirement. Otherwise, select the Custom Report option.
Configuring Custom Report
To configure Custom report:
In the Reports page, select Report Templates > Custom Report.
In the Clone page, enter unique name for the report and click Next.
In the Format page:
Select the required charts from User, Device and Application sections.
Select the report format (PDF, JSON, or CSV).
Select the check box if you want to save the report as a template.
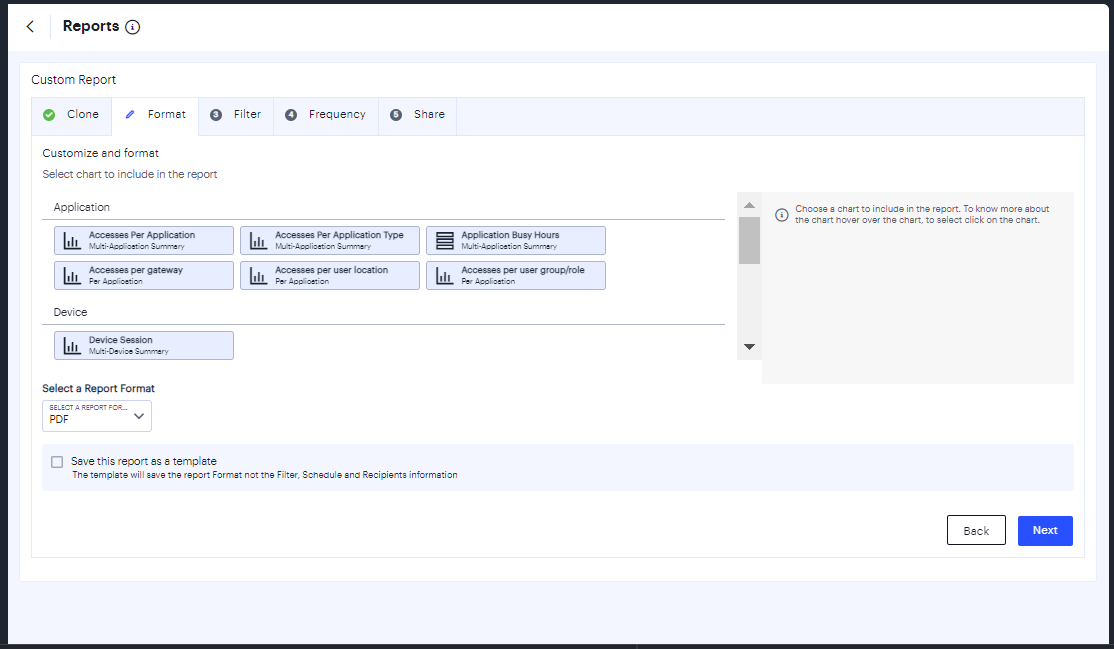
FIGURE 127 The Format page
Click Next.
In the Filter page, select the data filter from User, Device, Gateway and Application attributes. Then click Next.
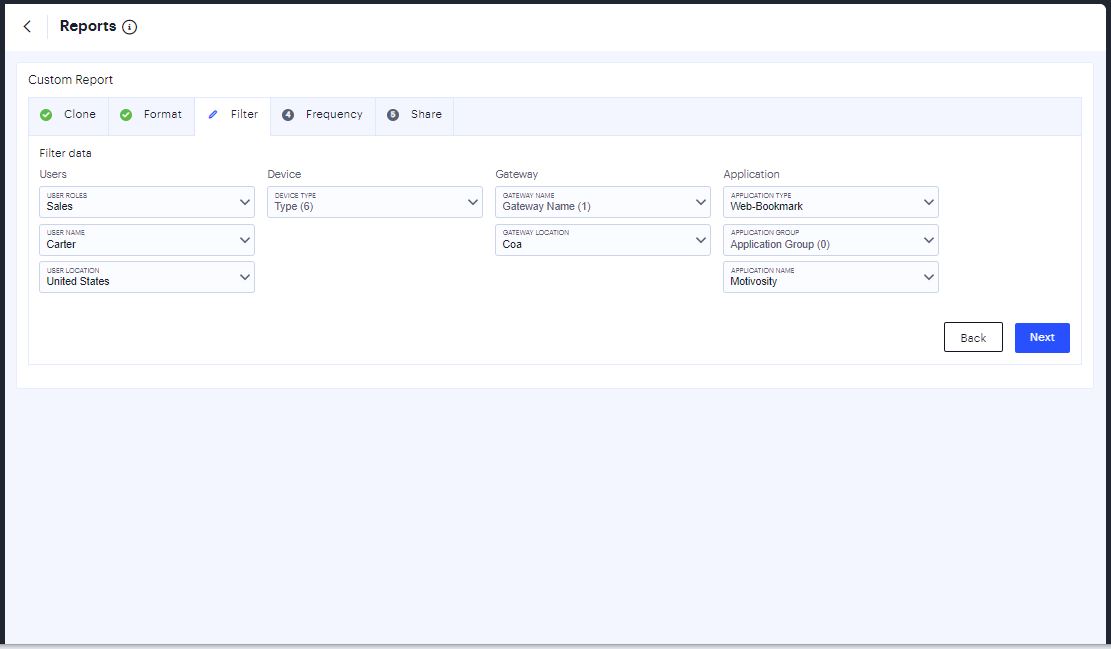
FIGURE 128 The Filter page
In the Frequency page:
Set recurring date range - Click the calendar icon, specify the start date and the end date, and then click Apply.
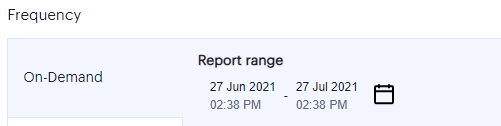
Frequency - Select one of the options:
On Demand: Click the calendar icon, select the start date and the end date of the report, and then click Apply.
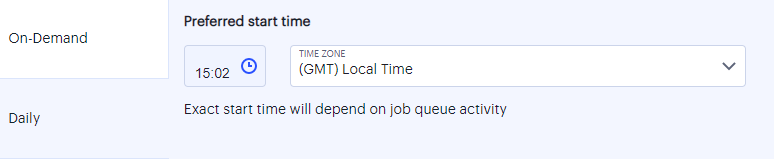
Daily: Click the time icon and select the start time. Then select the time zone from the drop-down list.
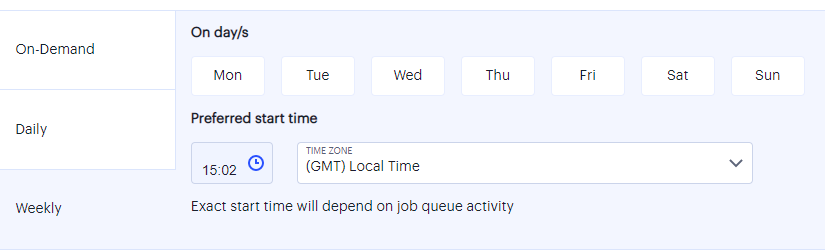
Weekly: Select the days of the week. Click the time icon and select the start time. Then select the time zone from the drop-down list.
Click Next.
In the Share page, select the admin users from the list to whom the notifications need to be sent, and click Confirm and Schedule.
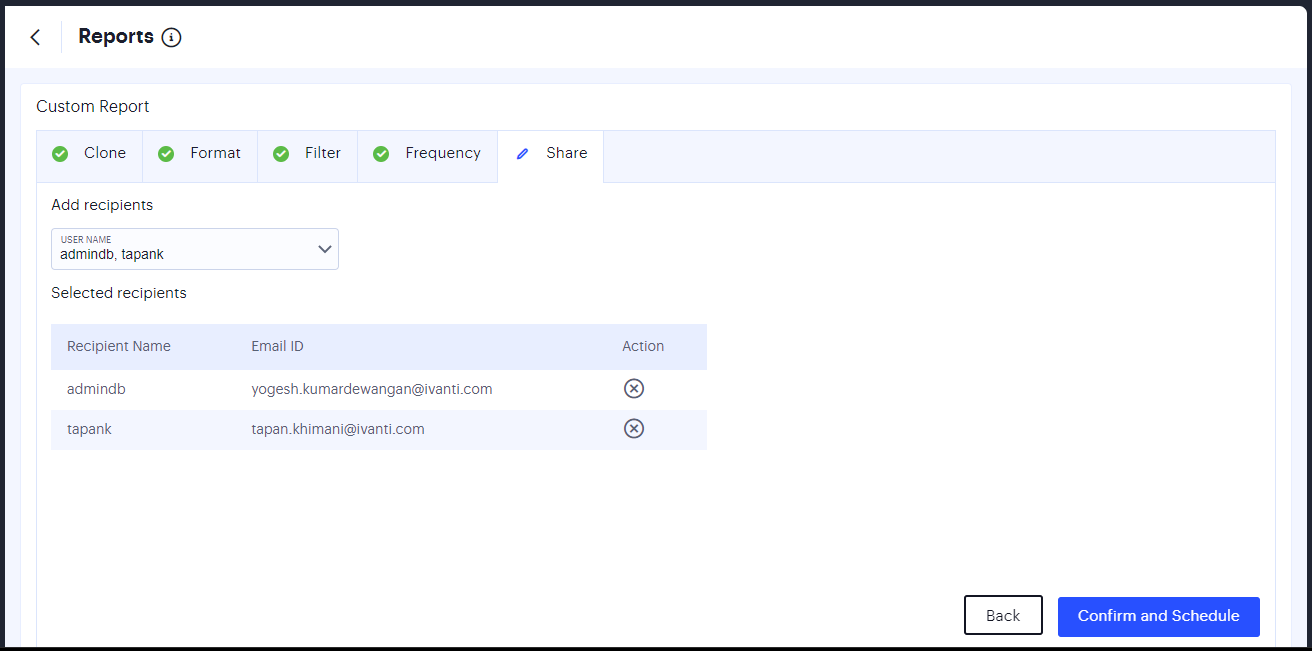
FIGURE 129 The Share page
In the Confirm Submission page, verify the details and then click Schedule Report.
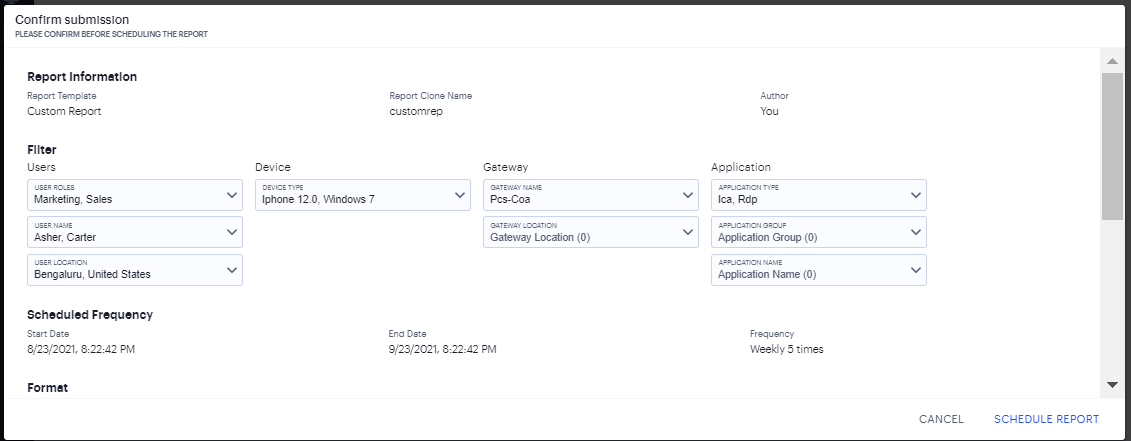
FIGURE 130 The Share page
The report will be generated per schedule and listed in the My Reports page.
Click the report name link to view the summary of the configured details.
Click the download icon located next to the report to view report in the specified format (PDF, JSON, or CSV)
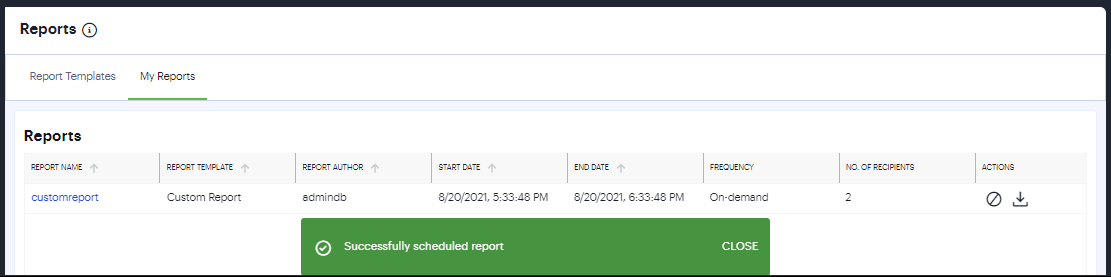
FIGURE 131 The My Reports page
Configuring Pre-defined Report
To configure pre-defined report:
In the Reports page, select Report Templates > <pre-defined report>.
In the Clone page, enter unique name for the report and click Next.
In the Format page:
Select the required charts from User, Device and Application sections, as applicable. By default, all the pre-defined template charts are selected.
Select the report format (PDF, JSON, or CSV).
Click Next.
Configure the Filter, Frequency and Share pages as described in Configuring Custom Report
In the Confirm Submission page, verify the details and click Schedule Report.
The report will be generated per schedule and listed in the My Reports page.
Click the report name link to view the summary of the configured details.
Click the download icon located next to the report to view report in the specified format (PDF, JSON, or CSV)
Managing the Sessions
Ivanti Connect Secure Sessions Management page allows you to manage the Active Sessions, Exported IF-MAP Sessions, Imported IF-MAP Sessions and ActiveSync Devices.
To navigate to Session Management page:
Log in to the Ivanti Neurons for Secure Access Admin portal as a Tenant Admin, and select Ivanti Connect Secure from the Gateway Switcher (9 dots). See Logging in to Ivanti Neurons for Secure Access.
From the Ivanti Connect Secure menu, click the Insights icon, then select Session Management > Active Sessions.
The Session Management page is displayed. It presents the various sessions tabs to manage the sessions.
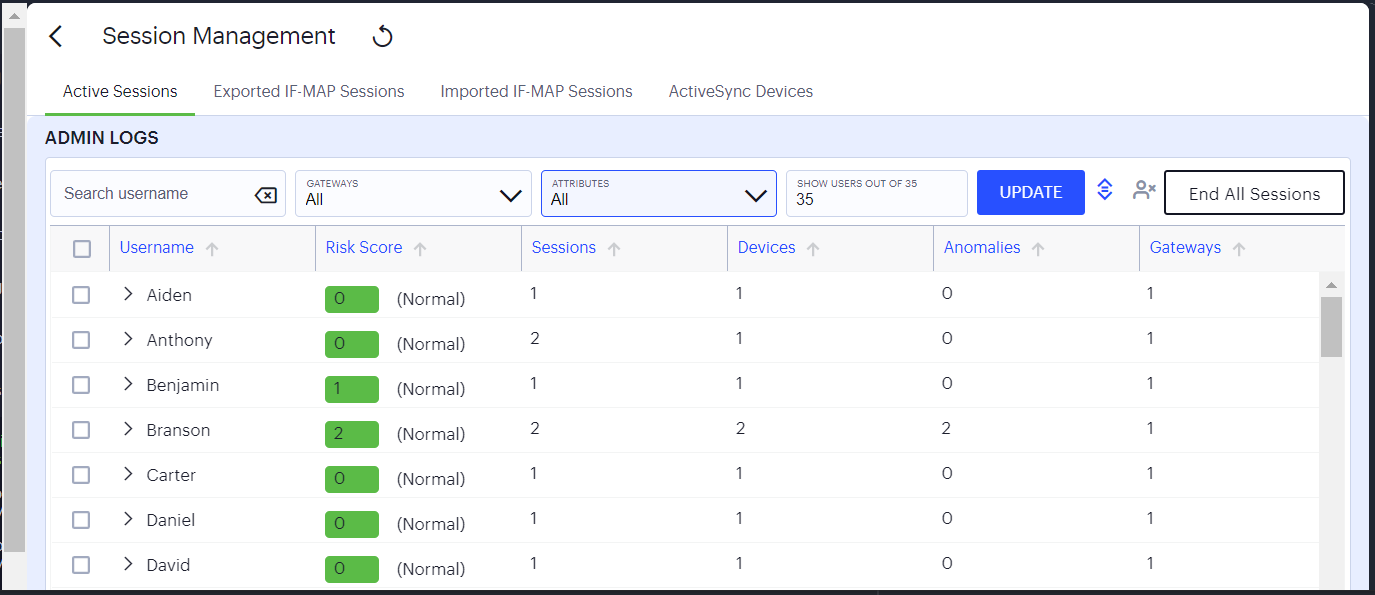
FIGURE 132 Session Management page
The logs data presented can be sorted based on the column.
To manually refresh the data, click the circular arrow:
FIGURE 133 Refreshing the data
Managing Active Sessions
To view Active Sessions:
In the Session Management page, select the Active Sessions tab.
The Users list is displayed.
Click the > icon that is present next to a user name.
An expanded list shows all the active sessions of that user.
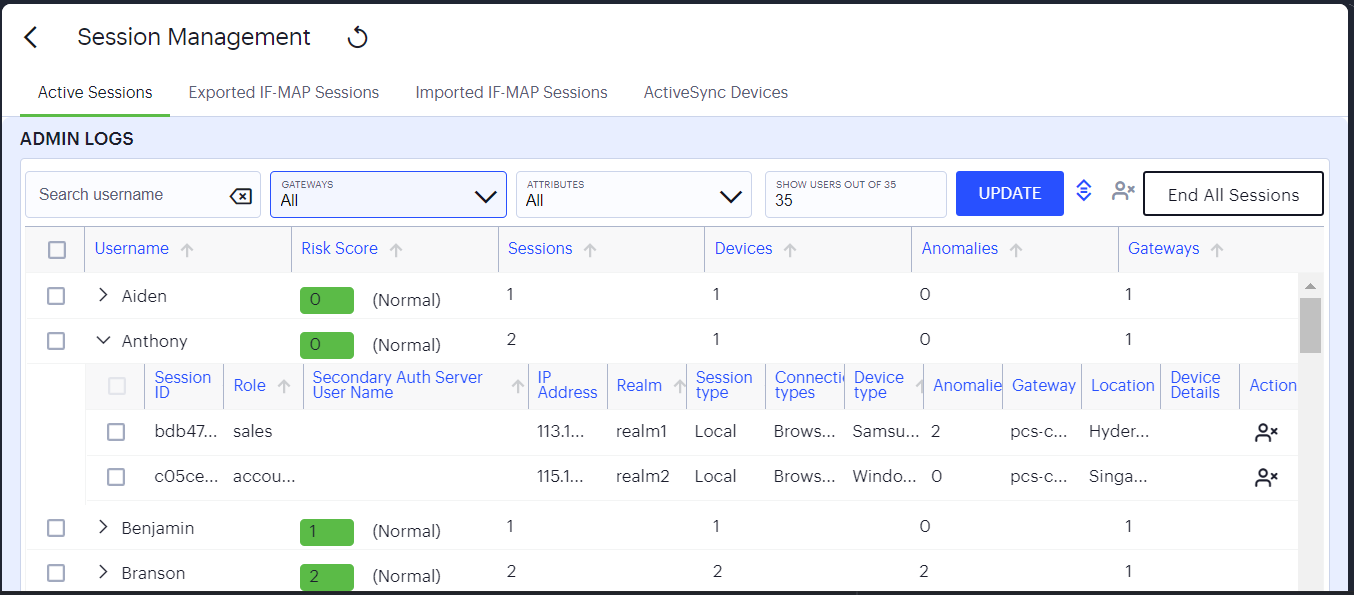
FIGURE 134 Active Sessions
To view active sessions of all the users, click the Expand/Collapse icon.

FIGURE 135 Expand/Collapse rows icon
To view the active sessions in a specific Gateway, select the Gateway from the Gateways list and click Update.
To view sessions based on the risk, select the appropriate option from the Attributes list.
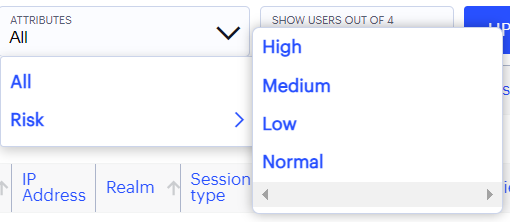
FIGURE 136 Sessions based on risk type
To terminate user session:
In the Users list, click the > icon that is present next to the user name.
An expanded list shows all the active sessions of that user. .
Click the Terminate User Session icon available in the Action column corresponding to the session you want to delete.

FIGURE 137 Terminate User Session icon
To terminate all the sessions, click the End All Sessions button provided at the top-right corner of the page.
Viewing Exported IF-MAP Sessions
To view Exported IF-MAP Sessions:
In the Session Management page, select the Exported IF-MAP Sessions tab.
The Exported IF-MAP Sessions page is displayed. The page shows a list of Exported IF-MAP Sessions.
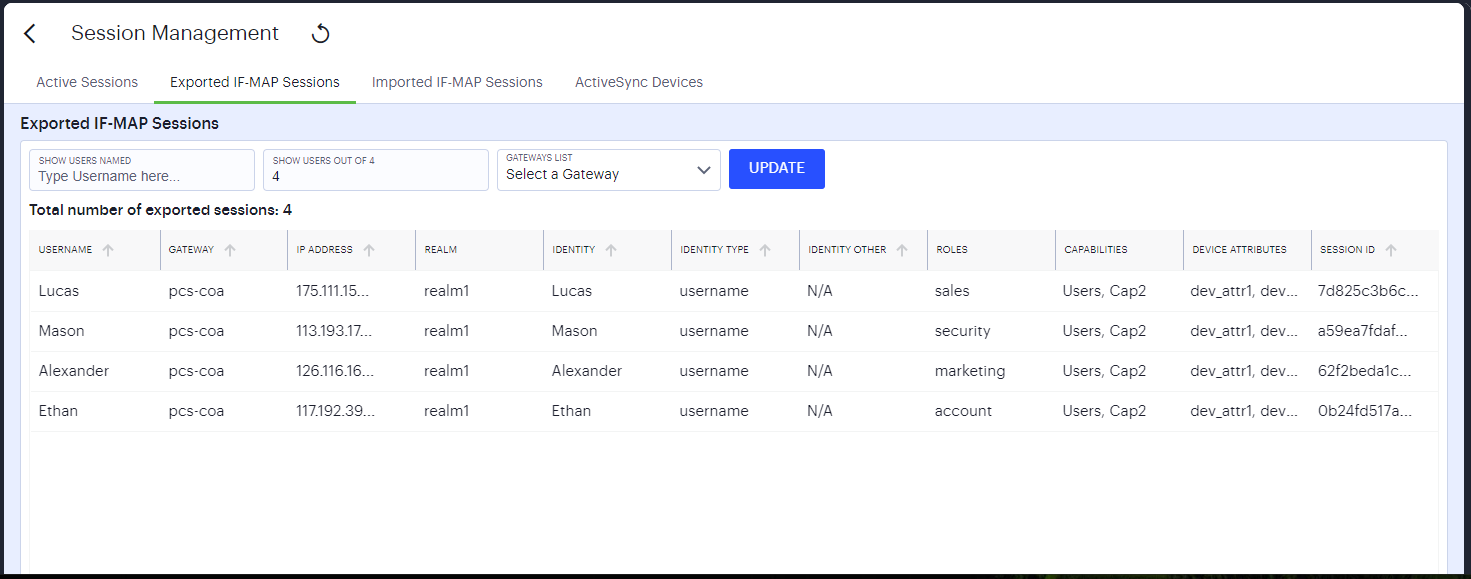
FIGURE 138 Exported IF-MAP Sessions
You can sort the list based on the column.
To view the sessions by a specific user, enter the username in the Username field and click Update.
To view all the sessions associated to a specific Gateway, select the Gateway from the drop-down list and click Update.
Managing Imported IF-MAP Sessions
To manage Imported IF-MAP Sessions:
In the Session Management page, select the Imported IF-MAP Sessions tab.
The Imported IF-MAP Sessions page is displayed. The page shows a list of Imported IF-MAP Sessions.
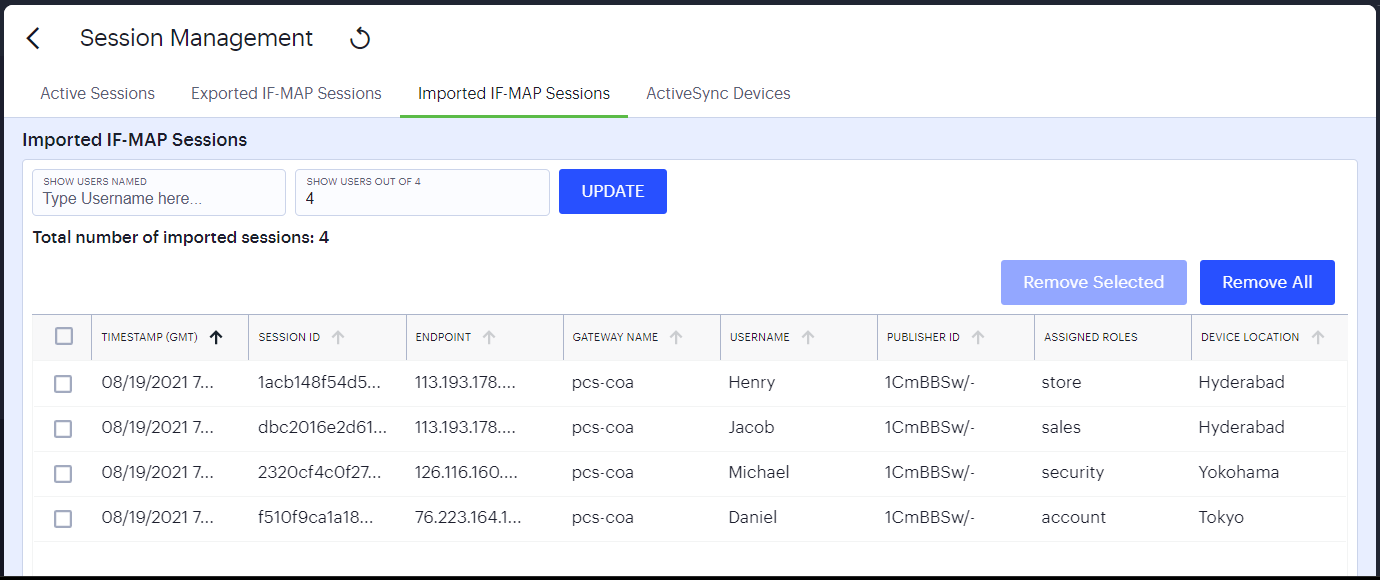
FIGURE 139 Imported IF-MAP Sessions page
You can sort the list based on the column.
To view the sessions by a specific user, enter the username in the Username field and click Update.
To remove session:
In the IF-MAP Imported Sessions page, select the check box(es) present next to the sessions that you want to remove and click the Remove Selected button.
To remove all the sessions, click the Remove All button.
Managing ActiveSync Devices
The ActiveSync Devices page shows all ActiveSync Device sessions that are currently active across all Gateways that are registered with nSA.
To view ActiveSync Devices:
In the Session Management page, select the ActiveSync Devices tab.
The ActiveSync Devices page is displayed. The page shows a list of devices.
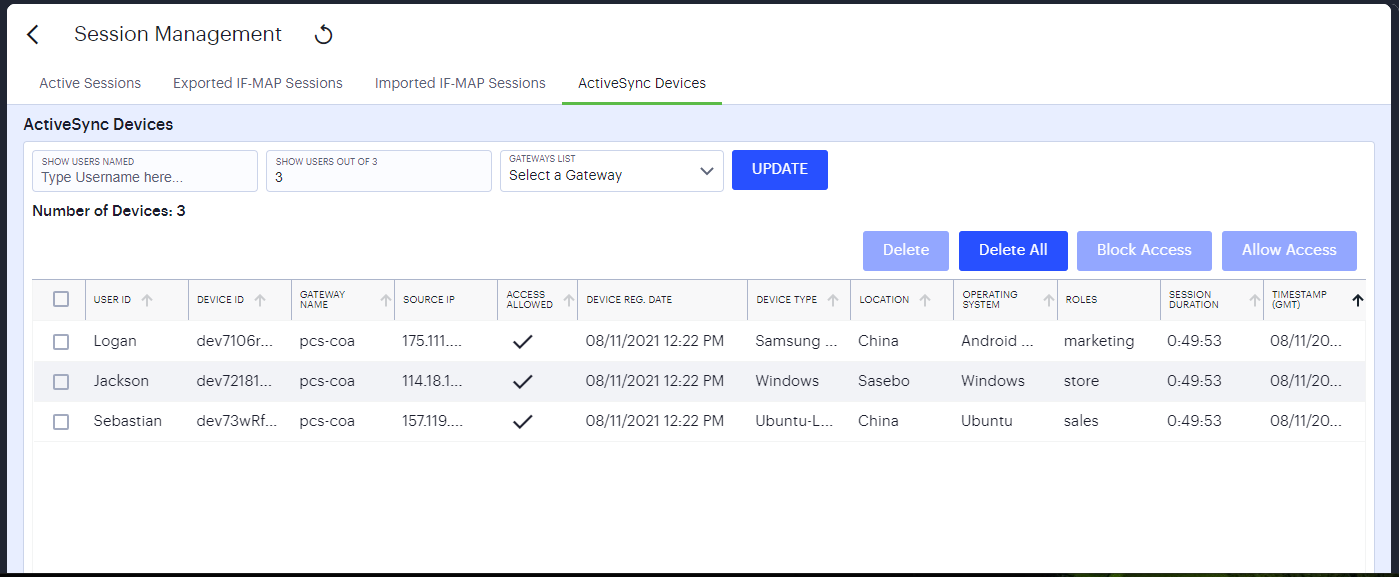
FIGURE 140 ActiveSync Devices page
You can sort the devices list based on the column.
To view the devices accessed by a specific user, enter the username in the Username field and click Update.
To view all the devices associated to a specific Gateway, select the Gateway from the drop-down list and click Update.
To block/unblock one or more devices:
In the Session Management page, select the ActiveSync Devices tab.
The ActiveSync Devices page is displayed that shows a list of devices.
The Access Allowed column shows if the device is blocked/allowed for use. The tick mark means the access is allowed for that device.
To block a device, select the check box(es) next to the device that you want to block and click Block Access.
The device is blocked, and a confirmation message is displayed.
To unblock a device, select the check box(es) next to the blocked device that you want to unblock and click Allow Access.
The devices is unblocked, and a confirmation message is displayed.
To remove one or more devices:
In the Session Management page, select the ActiveSync Devices tab.
The ActiveSync Devices page is displayed. The page shows a list of devices.
To remove one or more devices, select the check box(es) next to the device that you went to remove and click Delete.
To remove all the devices, click Delete All.
Viewing Alerts and Notifications
The Alerts page lists all alerts and notifications that have been raised by nZTA.
To view the Alerts page, click the Alerts icon and then click See all Alerts:
FIGURE 141 Alerts icon
The Alerts page appears. For example:
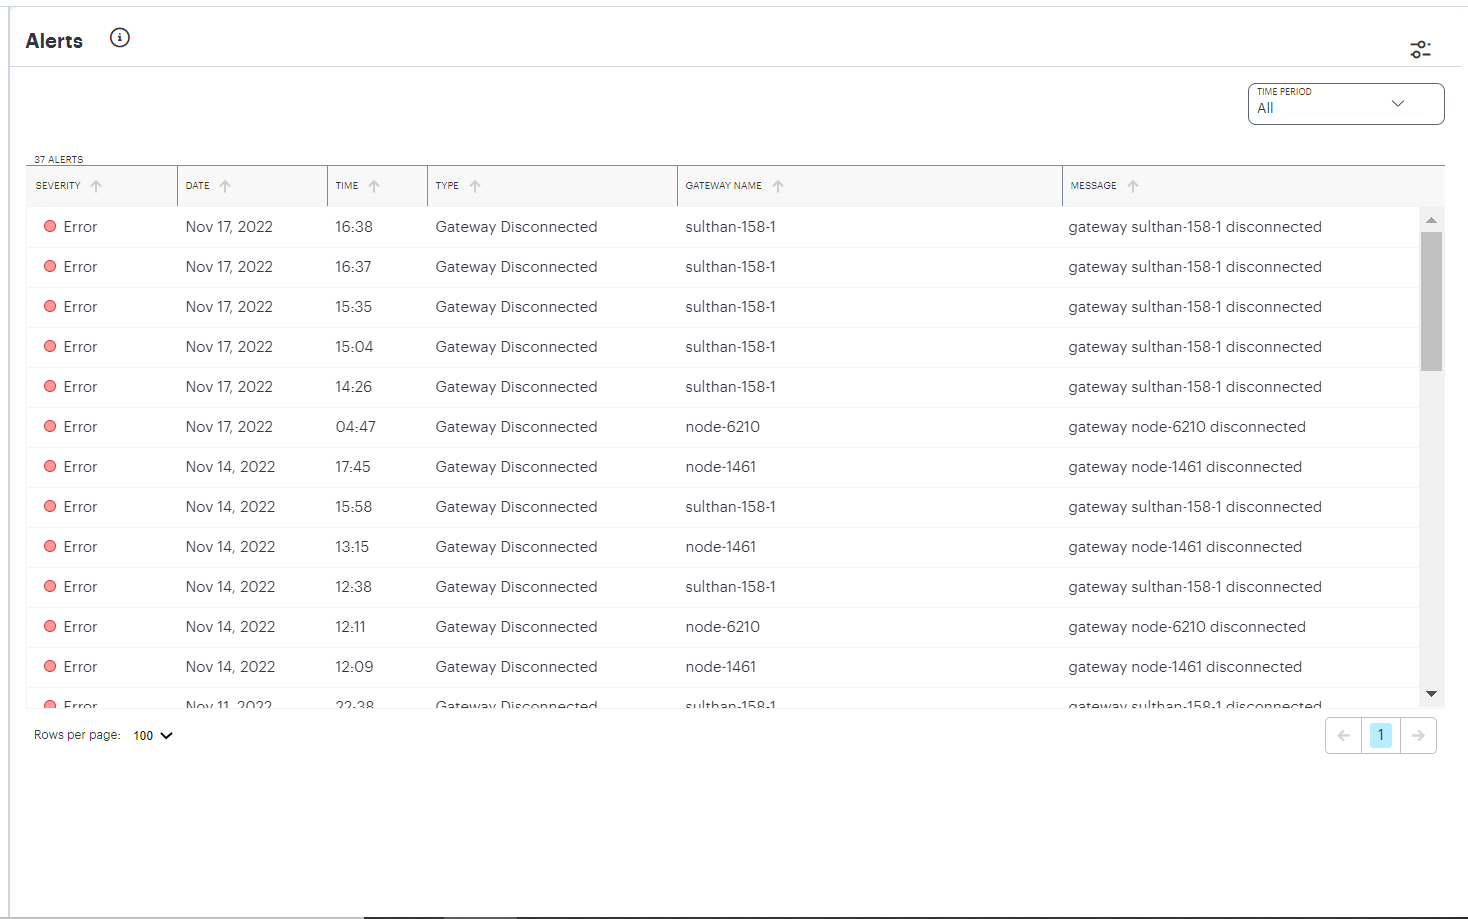
FIGURE 142 Alerts page
The alerts table supports the following alert types:
AAA Config Pull Failure
AAA Config Pull Success
AAA Config Pull Success - Failure Resolved
AAA Journal Update Failed
AAA Journal Update Success
Config Sync Rule Deleted
Config Sync Rule Updated
Config Sync Target Cluster Deleted
Custom Domain Certificate for mTLS Domain Due for Renewal
Custom Domain Certificate for mTLS Domain Expired
Custom Domain Certificate for TLS Domain Due for Renewal
Custom Domain Certificate for TLS Domain Expired
Device Vulnerability Risk Rating (VRR) Critical
Device Vulnerability Risk Rating (VRR) High
Device Vulnerability Risk Rating (VRR) Medium
Device Vulnerability Risk Rating (VRR) Low
Gateway Config Apply Failed
Gateway Config Import Failed
Gateway Disconnected
Gateway Invalid Configurations Cleared
Gateway Upgrade Failed
To filter the alerts table by type:
Click Configure Alert Rules icon.
FIGURE 143 Configure Alert Rules icon
The Configure Alerts & Notifications page appears.
Click Alert Types and select the required type.
Click Close.
To filter the alerts table by time period, click Time Period and select the required time period.
To sort the alerts table into ascending or descending order of a specific property, click on one of the following column headings in the alerts table:
Severity
Type
Message Type